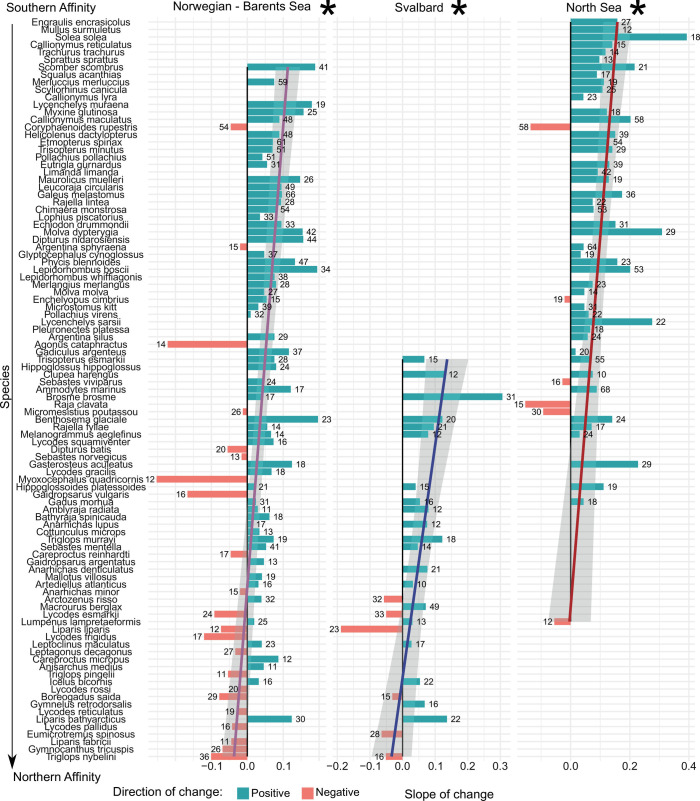
Fig. 6.
Change in the probability of species’ occurrence with time. Length of the bars correspond to the Slope of the effect of Year on species probability of occurrence, using a GAM model including swept area, latitude, and depth as smooth predictors, and Year as a linear predictor. Species are ordered by their mean latitude of occurrence during the study period. Linear regression on the effect of Year with mean latitude was conducted and plotted, and asterisks indicate significance (P < 0.05).

