Fig. 1.
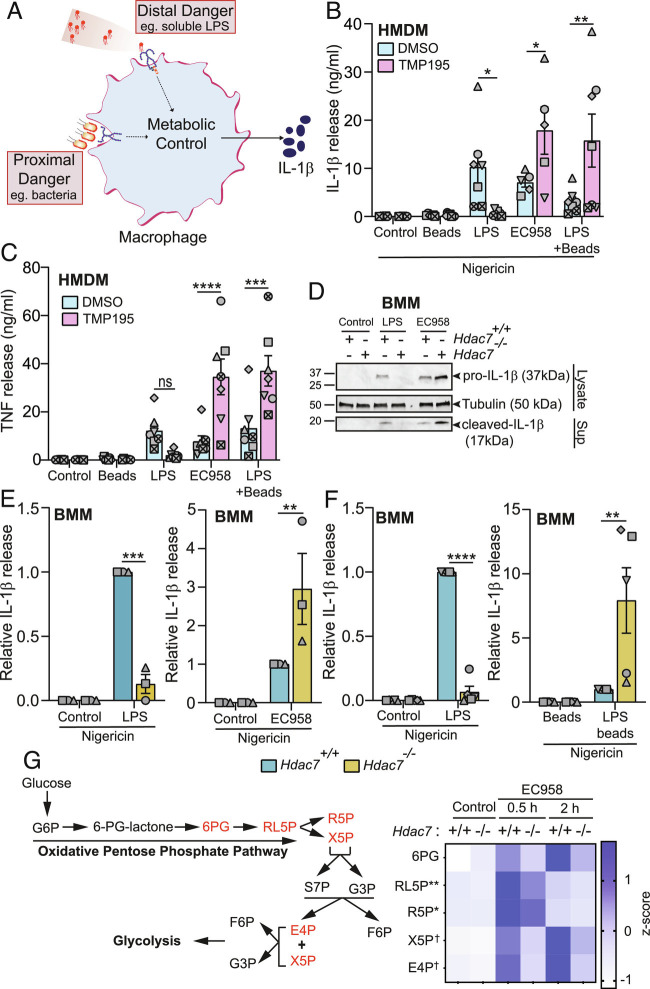
HDAC7 discriminates between distal and proximal threats during macrophage activation. (A) Model of immunometabolic control of macrophage responses to distal versus proximal danger signals. (B and C) IL-1β and TNF release from HMDM pretreated with TMP195 (10 μM) for 1 h followed by LPS (100 ng/mL), EC958 (MOI 100), or LPS and latex beads for 4 h. Additional nigericin (5 μg/mL) treatment for 2 h followed, where indicated. (D) Immunoblots for pro- and cleaved-IL-1β in indicated BMM populations treated with either LPS (1 ng/mL) or infected with EC958 (MOI 10) for 4 h, followed by nigericin for 1 h (representative of four independent experiments). (E and F) IL-1β release from the indicated BMM populations treated with either LPS (0.5 ng/mL; Left, E and F), infected with EC958 (MOI 10; E, Right), or LPS-coated latex beads (F, Right) for 4 h, followed by nigericin for 1 h. (G) A heatmap showing the expression patterns of pentose phosphate pathway metabolites (highlighted in red) in lysates from wild-type (Hdac7+/+) and Hdac7−/− BMM infected with EC958 (MOI 100, 30 min and 2 h). * and ** indicate statistical comparison between Hdac7+/+ and Hdac7−/− BMM at 30 min postinfection, and † indicates statistical comparison between Hdac7+/+ and Hdac7−/− BMM at 2 h postinfection. Graphical data (mean ± SEM, n = 3 to 7) are combined from three to seven independent experiments (or donors) performed in experimental duplicate. Data are normalized to the Hdac7+/+ LPS-treated, EC958-infected, or LPS-coated latex beads (E and F). Statistical significance was determined using repeated measure two-way ANOVA followed by Sidak’s multiple comparison test (ns, not significant; *P < 0.05; **P < 0.01; ***P < 0.001; ****P < 0.0001; †P < 0.05).

