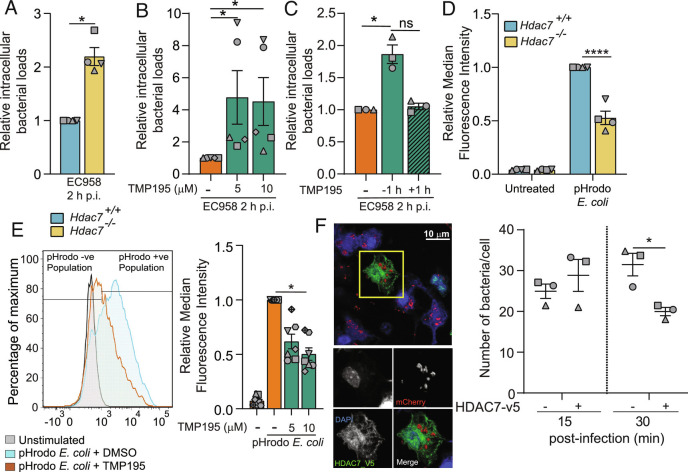
Fig. 2.
HDAC7 is required for macrophage-mediated Escherichia coli uptake and clearance. (A) Relative intramacrophage bacterial loads at 2 h p.i. in BMM infected with UPEC strain EC958. (B) Relative intramacrophage loads of EC958 at 2 h p.i. in BMM pretreated with the indicated concentrations of TMP195 for 1 h prior to infection. (C) Relative intramacrophage loads of EC958 at 2 h p.i. in BMM either pretreated with TMP195 for 1 h prior to infection or 1 h p.i. (D) Phagocytic uptake of pHrodo Escherichia coli in indicated BMM populations. (E) Phagocytic uptake of pHrodo Escherichia coli in BMM pretreated with the indicated concentrations of TMP195 for 30 min prior to treatment with pHrodo Escherichia coli. Representative flow cytometry plot for BMM (Left) as well as relative median fluorescence intensity (MFI) data (Right) are shown. (F) Mac-Hdac7 BMM were spin-infected with MG1655_mCherry for 5 min, after which cells were fixed at the indicated time points. Immunofluorescence was performed to detect cells harboring fluorescent bacteria. The indicated image (Left) is representative of three independent experiments. Manual quantification of bacterial numbers (Right) was performed across multiple images (minimum 26 cells per time point, per experiment) utilizing Image J. Graphical data (mean ± SEM, n = 3 to 7) are combined from three to seven independent experiments performed in experimental duplicates and are normalized to the Hdac7+/+ (A and D) or the no TMP195 control sample (B, C, and E). Statistical significance was determined using unpaired nonparametric Mann–Whitney test (A), Kruskal–Wallis test followed by Dunn’s multiple comparison test (B, C, and E) or repeated measure two-way ANOVA (D and F), followed by Sidak’s multiple comparison test or (ns, not significant; *P < 0.05; ****P < 0.0001).

