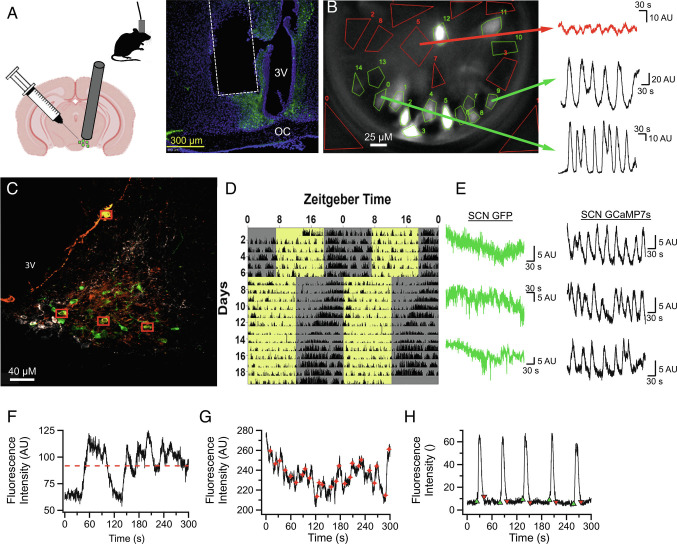
Fig. 1.
In Vivo Characterization of AVP Neurons in the SCN Network. (A) Left: Illustrations describing AAV infection of AVP neurons, GRIN implantation above the SCN, and tethered recordings using microendoscope. Right: example of histological validation of lens placement. Typical focal distance below the lens is ~200 μm. (B) Representative still image demonstrating how AVP calcium dynamics are observed in vivo. Green polygons are drawn around AVP neuronal ROI and the red polygons are non-AVP neuronal spaces used for background subtraction. Sample traces on the right illustrate examples of 5-min recordings obtained from AVP neurons in the same field of view. (C) Image of the SCN taken with a confocal microscope (63× lens) showing neuronal colocalization (yellow) of GCaMP7s (green) and AVP antibody (orange) as well as the exclusion of GCaMP7s from VIP expressing neurons (white). Red boxes indicate neurons with clear colocalization. (D) Representative actogram demonstrating that mice with a GRIN lens implanted above the SCN appear to have normal daily circadian behavior which shifts normally in response to a 6-h phase advance. (E) Representative calcium traces recorded from the SCN of AVPcre x GFP mice and AVPcre mice infected with GCaMP7s demonstrating that while GFP does not exhibit acute calcium dynamics, intracellular calcium dynamics are detected by GCaMP7s. F–H: Representative 5-min calcium traces demonstrating how mean fluorescence intensity (red dotted line, F), acute events (red stars, G), and calcium waves (onsets green; offsets red, H) were quantified for the purposes of determination of single-cell rhythmicity in Fig. 2.

