Fig. 2.
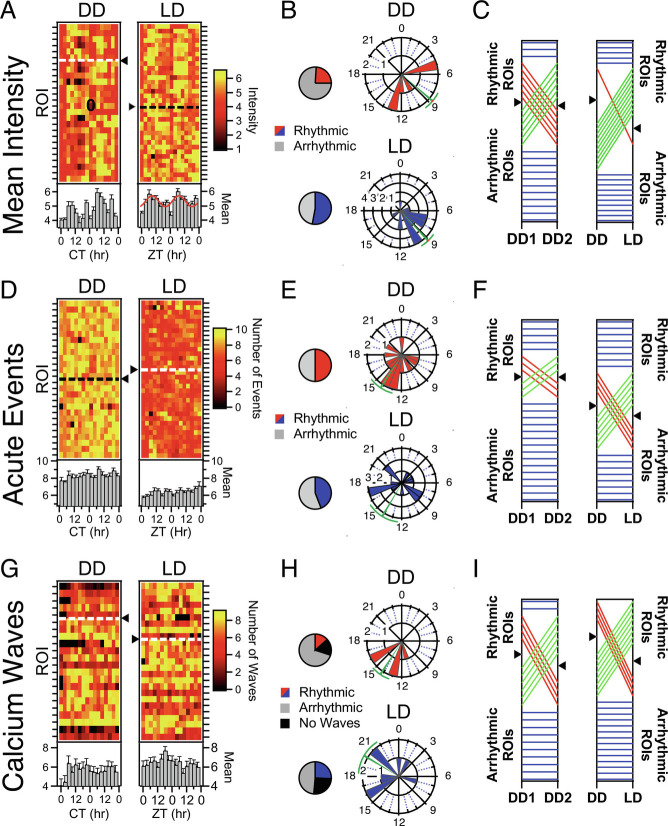
Circadian Rhythmicity in individual AVP Neurons is stochastic. (A) Heatmaps illustrating mean fluorescence intensity across the 5-min recording (see Fig. 1F) of individual AVP neurons/ROIs (rows) by recording timepoint (columns) in both DD and LD. Rows are normalized to their means. ROIs which exhibited significant circadian rhythms according to cosinor (P < 0.05) for mean intensity appear above the dashed line and triangle. ROIs that were not rhythmic are plotted below the dashed line. Plotted beneath the heatmap is the population average and standard errors for each timepoint. When the population measure is rhythmic (P < 0.05), the cosine fit is superimposed on Top of the bar graph. (B) Polar plots illustrating the phase distribution of ROIs exhibiting significant circadian rhythms in mean fluorescence in both DD and LD. The direction of the bar represents hour in CT for DD or ZT for LD. The length of the bar represents the number of ROIs. Circular mean and SEM are represented in green. Pie charts indicate the proportion that exhibited a statistically significant rhythm across the 48 h of DD and LD. (C) Phenotype tracking plots indicating the stability/change of rhythmic state of individual AVP neuron ROIs between the two recording days (DD day 1 and DD day 2) under constant darkness (Left) and between the 48 h recordings in each lighting condition (Right). Blue lines indicate stable rhythmic or arrhythmic ROIs, while red lines indicate a loss of rhythmicity between conditions, and green lines a gain of rhythmicity. Black triangles on the axes indicate the division between rhythmic (Above) and arrhythmic (Below) ROIs. (D–F) Rhythmicity measures for unsupervised acute events as quantified as described in Fig. 1G. Same conventions as A–C, above, except that raw event number is plotted in the heatmaps rather than normalized counts. (E–I): Rhythmicity measures for calcium waves, as quantified as described in Fig. 1H. Same conventions as A–C, above.

