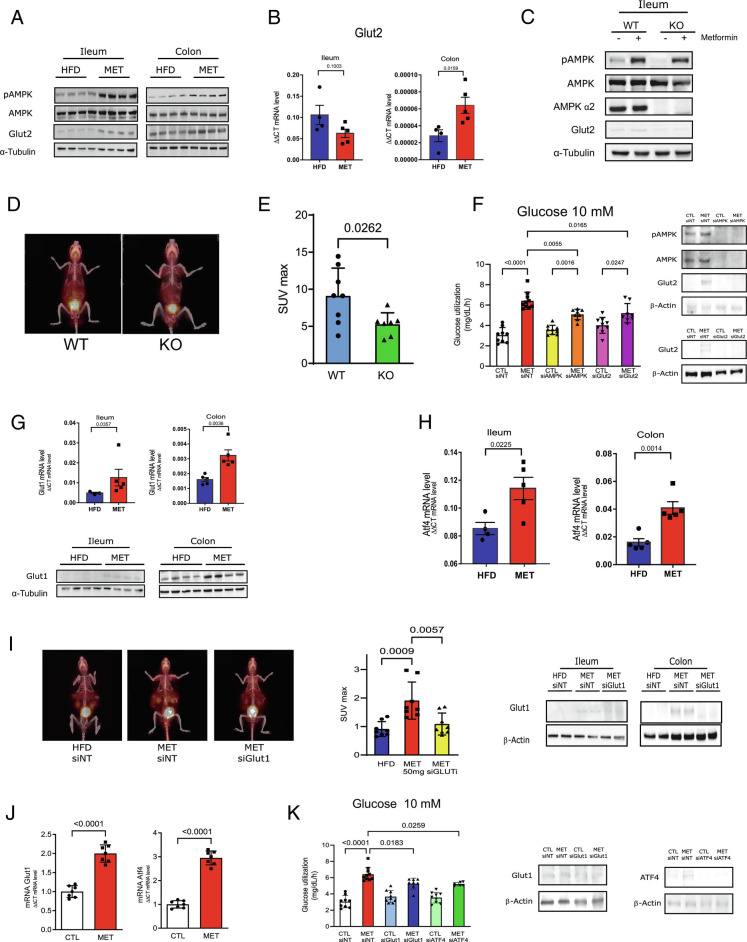
Fig. 2.
Metformin induces AMPK phoshorylation and modulates GLUT2 and GLUT1 in ileum and colon. (A) Protein phosphorylation and expression of AMPK and protein expression of Glut2 in ileum and colon from HFD and MET-treated mice (50 mg/kg for 10 d). (B) Glut-2 mRNA expression in ileum and colon from HFD and MET mice (50 mg/kg for 10 d). (C) Protein phosphorylation and expression of AMPK and expression of Glut2 in ileum from wild type (WT) and AMPK knock-out (KO) littermates mice treated or not with metformin (MET) (50 mg/kg for 10 d). (D) Representative images of whole-body 18F-FDG PET/CT scanning from mice and 18F-FDG biodistribution analysis (SUVmax) in the intestine from AMPK wild type (WT) and knock-out (KO) mice treated with metformin and (E) SUVmax quantification in the intestine. (Student’s t test, P < 0.05, n = 5). (F) Glucose uptake at 10 mM glucose concentrations in CaCo2 cells after the incubation with metformin (MET 1 mM to 16 h) in cells pre-treated with siRNA of AMPK, GLUT2 and non-targeting, as control (siNT) (one-way ANOVA and Bonferroni’s test, P < 0.05). (G) Glut-1 mRNA and protein expression in ileum and colon from HFD and MET mice (50 mg/kg for 10 d). (H) ATF-4 mRNA expression in ileum and colon from HFD and MET mice (50 mg/kg for 10 d) (n = 6). (I) Representative images of whole-body 18F-FDG PET/CT scanning from mice and 18F-FDG biodistribution analysis (SUVmax) in the intestine from mice treated with non-targeting siRNA or Glut1siRNA and with metformin (50 mg/kg for 10 d) and expression of Glut1 in ileum and colon (ANOVA, Bonferroni post test, P < 0.05, n = 5). (J) Glut-1 and ATF4 mRNA expressions in CaCo2 cells. (K) Glucose uptake at 10 mM glucose concentrations in CaCo2 cells after the incubation with metformin (MET 1mM to 16h) and siRNA-mediated knockdown of GLUT1, ATF4 and non-targeting, as control (siNT) and expression of Glut1 and Atf4 in CaCo2 cells (one-way ANOVA and Bonferroni’s test.)

