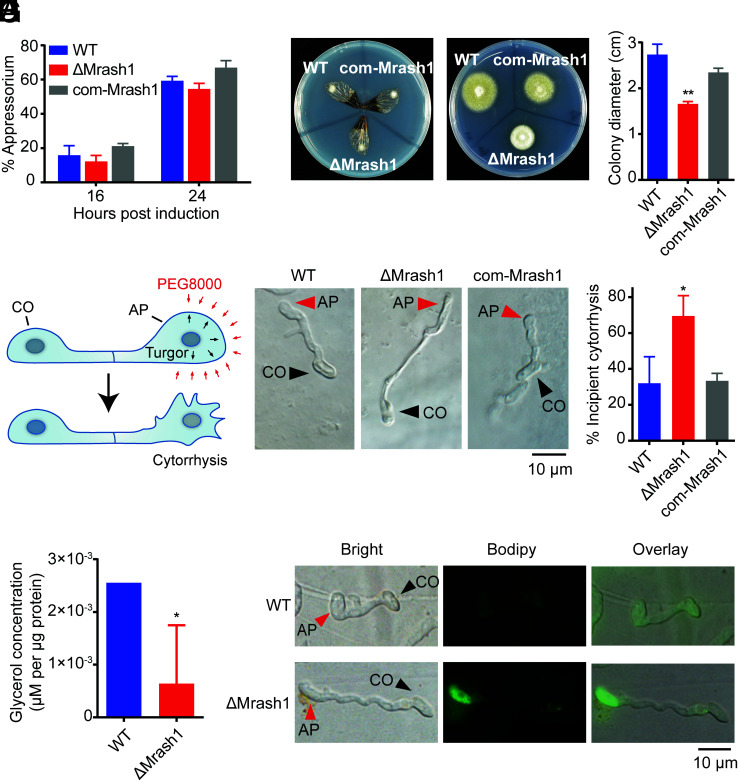
Fig. 2.
ΔMrash1 exhibits defects in cuticle penetration, appressorium turgor generation, glycerol accumulation, and lipid droplet degradation in M. robertsii. (A) The percentage of germinated conidia with appressoria relative to the total germinated conidia at 16 h and 24 h after induction in MM-Gly medium on hydrophobic plates. Data are shown as the mean ± SD of three biological replicates. The experiments were repeated twice with similar results. (B) The penetration capacity of WT, ΔMrash1, and com-Mrash1 was assayed using cicada wings. Mycelial blocks inoculated on the cicada wings were incubated for 2 d (Left). Then, the cicada wings were removed, and the plates were incubated for an additional 5 d (Right). (C) Colony diameters of WT, ΔMrash1, and com-Mrash1 at 5 d after removing the cicada wings in the cuticle penetration assay. Data are shown as the mean ± SD of three biological replicates. Significant differences compared with those in WT were determined by Student's t test. **P < 0.01. The experiments were repeated twice with similar results. (D) A schematic model of the incipient cytorrhysis assay. Black and red arrows in the upper image indicate appressorium turgor pressure and exogenous pressure exerted on the appressorium cell wall by PEG8000, respectively. The appressorium collapsed when the pressure of PEG8000 exceeded the appressorium turgor pressure, as shown in the lower image. (E) Microscopic images of WT, ΔMrash1, and com-Mrash1 appressoria induced on cicada wings after immersion in PEG8000 for 10 min in an incipient cytorrhysis assay. (F) Percentage of appressoria induced on cicada wings that underwent incipient cytorrhysis after immersion in PEG8000 for 10 min. Data are shown as the mean ± SD of three biological replicates. Significant differences compared with those in WT were determined by Student's t test. *P < 0.05. The experiments were repeated twice with similar results. (G) Intracellular glycerol levels in WT and ΔMrash1 appressoria induced on hydrophobic plates. Data are shown as the mean ± SD of three biological replicates. Significant differences compared with those in WT were determined by Student's t test. *P < 0.05. (H) Distribution of lipid droplets in appressoria of WT and ΔMrash1 induced on cicada wings. Lipid droplets were stained with BODIPY. CO, conidium; AP, appressorium.

