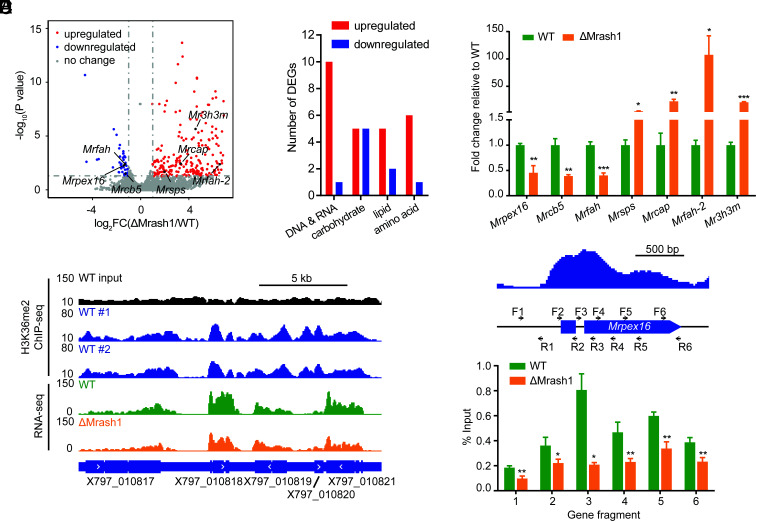
Fig. 3.
MrASH1 positively regulates the peroxin gene Mrpex16 in M. robertsii. The mycelia of WT and ΔMrash1 incubated in MM2 medium supplemented with adult locust cuticle for 8 h were analyzed by a combined RNA-seq and H3K36me2 ChIP-seq analysis. (A) Volcano plot of DEGs (fold change ≥ 2, P < 0.05) between WT and ΔMrash1 identified by transcriptome analysis. Significantly up-regulated, down-regulated, and unchanged genes in ΔMrash1 compared with those in WT are marked in red, blue, and gray, respectively. Lipid metabolism–related genes are marked in black. (B) DEGs by gene ontology category (primary metabolism). Red and blue columns represent the number of genes up-regulated and down-regulated in ΔMrash1 compared with that in WT, respectively. (C) qPCR analysis of lipid metabolism–related genes in the mycelium of WT and ΔMrash1 cultured in MM2 medium supplemented with adult locust cuticle. Data are shown as the mean ± SD of three technical replicates. Statistical significance was determined with Student's t test. *P < 0.05, **P < 0.01, and ***P < 0.001. gpd was used as a reference gene. The experiments were repeated twice with similar results. (D) Representative genome browser view of the enrichment of H3K36me2 in two WT replicates and mRNA signals in WT and ΔMrash1. (E) H3K36me2 levels at the Mrpex16 gene locus in WT and ΔMrash1. The upper image shows H3K36me2 enrichment at the Mrpex16 gene locus in WT, as determined by ChIP-seq analysis, and the black arrows indicate the position and polarity (5′-3′) of the primers used for ChIP–qPCR. The lower image shows ChIP–qPCR validation of ChIP-seq shown as the percentage of the signal from immunoprecipitation over the input in WT and ΔMrash1. Data are shown as the mean ± SD of three technical replicates. Statistical significance was determined with Student's t test. *P < 0.05 and **P < 0.01. The experiments were repeated twice with similar results.

