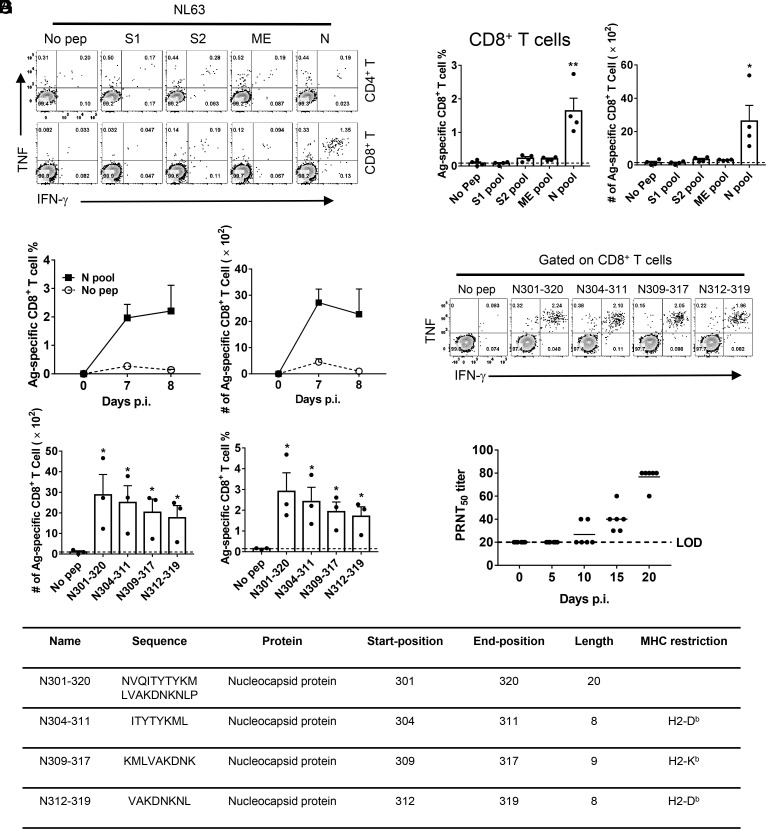
Fig. 4.
NL63 infection-induced virus-specific T cell response and neutralizing antibodies in mice. (A and B) Ad5-hACE2-transduced IFNAR−/− C57BL/6 mice were infected with 1.0 × 10⁴ PFU of NL63. To identify NL63 T cell responses, single-cell suspensions were prepared from the BALF of transduced/infected IFNAR−/− C57BL/6 mice and stimulated with 2 μM structural protein peptide pools for 5 to 6 h in the presence of brefeldin A. Flow plots [(A), 7 d.p.i.], and summary of frequencies and cell numbers of NL63-specific CD8+ T cells (B) (determined by IFN-γ intracellular staining) are shown (n = 4 mice per time point). (C) To determine the kinetics of virus-specific T cell responses in IFNAR−/− C57BL/6 mice, single-cell suspensions were prepared from the BALF of transduced/ infected IFNAR−/− C57BL/6 mice at indicated time points and stimulated with 2 μM N protein peptide pools for 5 to 6 h in the presence of brefeldin A. The frequencies (Left) and cell numbers (Right) of NL63-specific CD8+ T cells from BALF are shown (n = 3 mice at 7 d.p.i. and n = 4 mice at 8 d.p.i.). (D and E) Confirmation of NL63-specific-CD8+ T cell epitopes in IFNAR−/− C57BL/6 mice (8 d.p.i.). Flow plots (D) and summary panels (E) are shown. (F) Characteristics of NL63-derived CD8+ T cell epitopes in IFNAR−/− C57BL/6 mice. (G) PRNT50 titers of the sera of hACE2-transduced/NL63-infected IFNAR−/− C57BL/6 mice were determined at indicated time points p.i. (n = 6 mice). (*P ≤ 0.05, **P ≤ 0.005, ***P ≤ 0.0005, ****P ≤ 0.0001).

