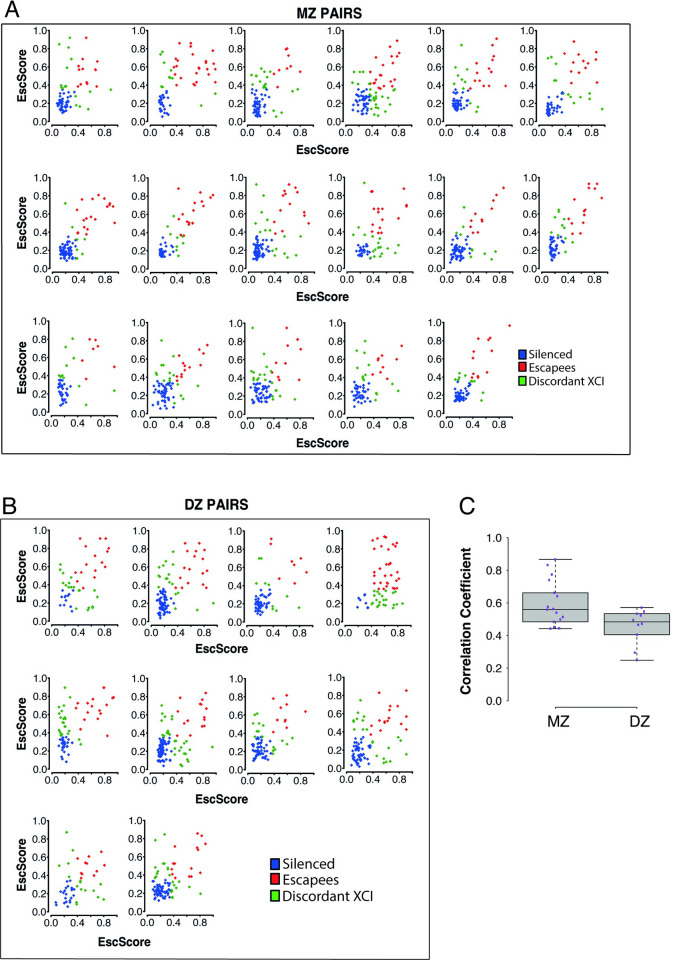
Fig 4.
Scatterplots of EscScore(s) of genes (≥5) with data available in both co-twins of a pair. A total of 27 complete twin pairs (both co-twins exhibiting skewed XCI in LCLs) were used. Each dot represents a gene, colored in blue if silenced in both co-twins, red if escaping XCI in both co-twins, and green if exhibiting discordant XCI (escaping only in one co-twin). (A) Monozygotic (MZ) twin pairs (N = 17); (B) Dizygotic (DZ) twin pairs (N = 10). (C) Boxplots of coefficients of correlation between EscScore(s) in the two co-twins of each pair.

