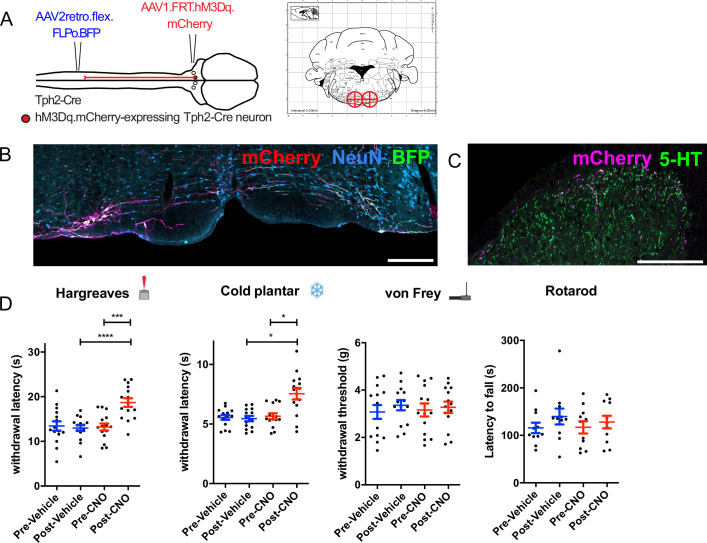
Figure 5. Chemogenetic activation of descending serotonergic LPGi neurons.
(A). Injection scheme for expressing the excitatory DREADD hM3Dq in spinally projecting Tph2-Cre neurons. Brain injection coordinates according to the mouse brain atlas (−6,+/-0.5, 5.9 from bregma). (B). Example of the injection site from the hindbrain of a mouse that received a spinal dorsal horn injection of AAV2retro.flex.FLPo.BFP followed by a bilateral hindbrain injection of AAV1.FRT.hM3Dq.mCherry 1 week later (scale bar = 200 μm). (C). Example of the ipsilateral spinal dorsal horn form an animal that had received the injections indicated in A. Note that most 5-HT-containing terminals are not labeled, but the majority of labeled terminals contain a detectable level of 5-HT (scale bar = 200 μm). (D). Sensory tests of the ipsilateral hindpaw: Hargreaves plantar assay; repeated measures one-way ANOVA, (F(3, 42)=16.93, p<0.0001), post hoc tests with Bonferroni’s correction detected differences between post-vehicle and post CNO, as well as pre-CNO and post-CNO (adjusted p values are p=0.007 and p<0.0001 respectively). Cold plantar assay; repeated measures one-way ANOVA, (F(3, 39)=12.41, p<0.0001) post hoc tests with Bonferroni’s correction detected differences between post-vehicle and post CNO, as well as pre-CNO and post-CNO (adjusted p values are p=0.0122 and p=0.0103, respectively). von Frey test; repeated measures one-way ANOVA, (F(3, 39)=0.5013 p=0.6836). Rotarod test for sensorimotor coordination/sedation; repeated measures one-way ANOVA, (F(3, 30)=0.8684, p=0.4683). Significance: *p<0.05, **p<0.01, ***p<0.001.
Figure 5—figure supplement 1. Chemogenetic activation of hM3Dq-labeled neurons.
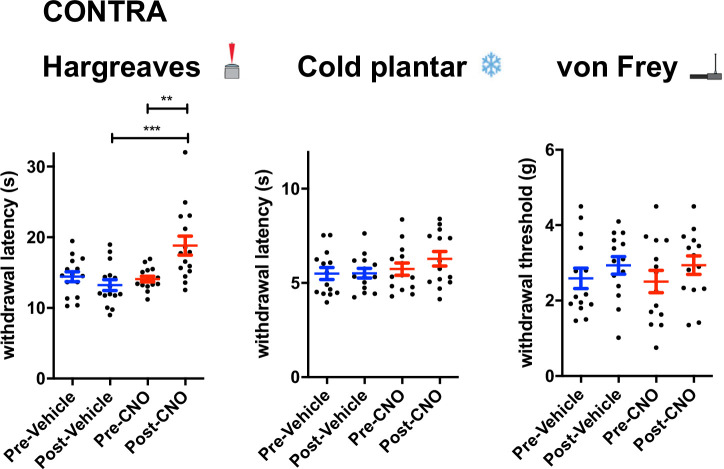
Figure 5—figure supplement 2. Altered sensitivity of the contralateral paw following LPGi activation.
Figure 5—figure supplement 3. Both male and female mice show alterations in thermal thresholds following chemogenetic activation of LPGi serotonergic neurons.
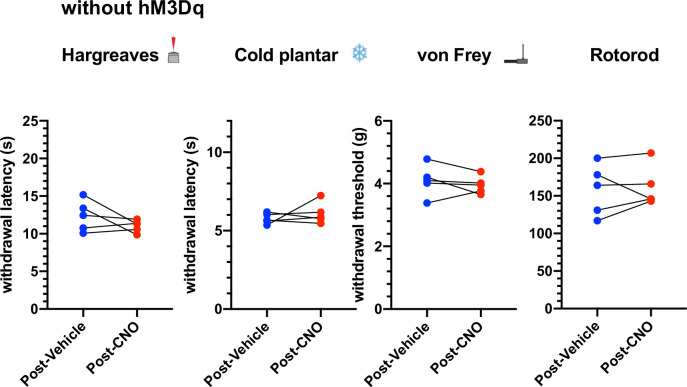
Figure 5—figure supplement 4. CNO does not alter response latencies, thresholds or sensorimotor coordination in the absence of hM3Dq.
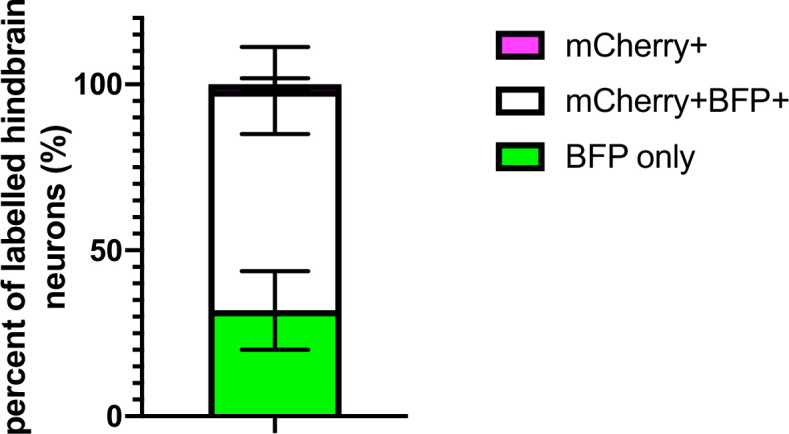
Figure 5—figure supplement 5. Proportion of AAV2retro-traced neurons labeled with hM3Dq-mCherry for behavioral experiments.


