. 2023 Feb 21;12:e83291. doi: 10.7554/eLife.83291

Figure 3. Transcriptomic analysis of transcription factor (TF)-induced granulosa-like cells.

(A) Gene expression of selected markers in granulosa-like cells. Log2(TPM) values for gondal/granulosa, adrenal, and pluripotent marker genes were compared between 7 wpf male and female fetal gonad somatic cells, primary and primordial granulosa cells, TF-induced FOXL2+ cells, KGN cells, COV434 cells, and human induced pluripotent stem cells (hiPSCs). (B) Transcriptome overlap measure (TROM) comparison of TF-induced FOXL2+ cells, COV434 cells, and hiPSCs with published in vivo data from different time points in ovarian development. (C) Regulatory effects of granulosa-related TFs. RNA-seq was performed after 2 days of TF overexpression in hiPSCs (TFs shown in magenta). A differential gene expression (DEG) analysis was performed for all samples relative to the hiPSC control (n = 2 biological replicates each). Black arrows represent significant (false discovery rate <0.05) upregulation, with the width proportional to the log2-fold change. Interactions are shown between TFs (magenta) and granulosa marker genes (yellow), as well as the stromal/theca marker NR2F2 (red) and the pre-granulosa marker LGR5 (green). (D–I) Volcano plots showing DEGs in the TF overexpression experiments. Colors are as in panel C; other DEGs not listed in panel C are shown in blue. Not all DEGs could be labeled due to space limits, but they are listed in the Source Data for this figure.

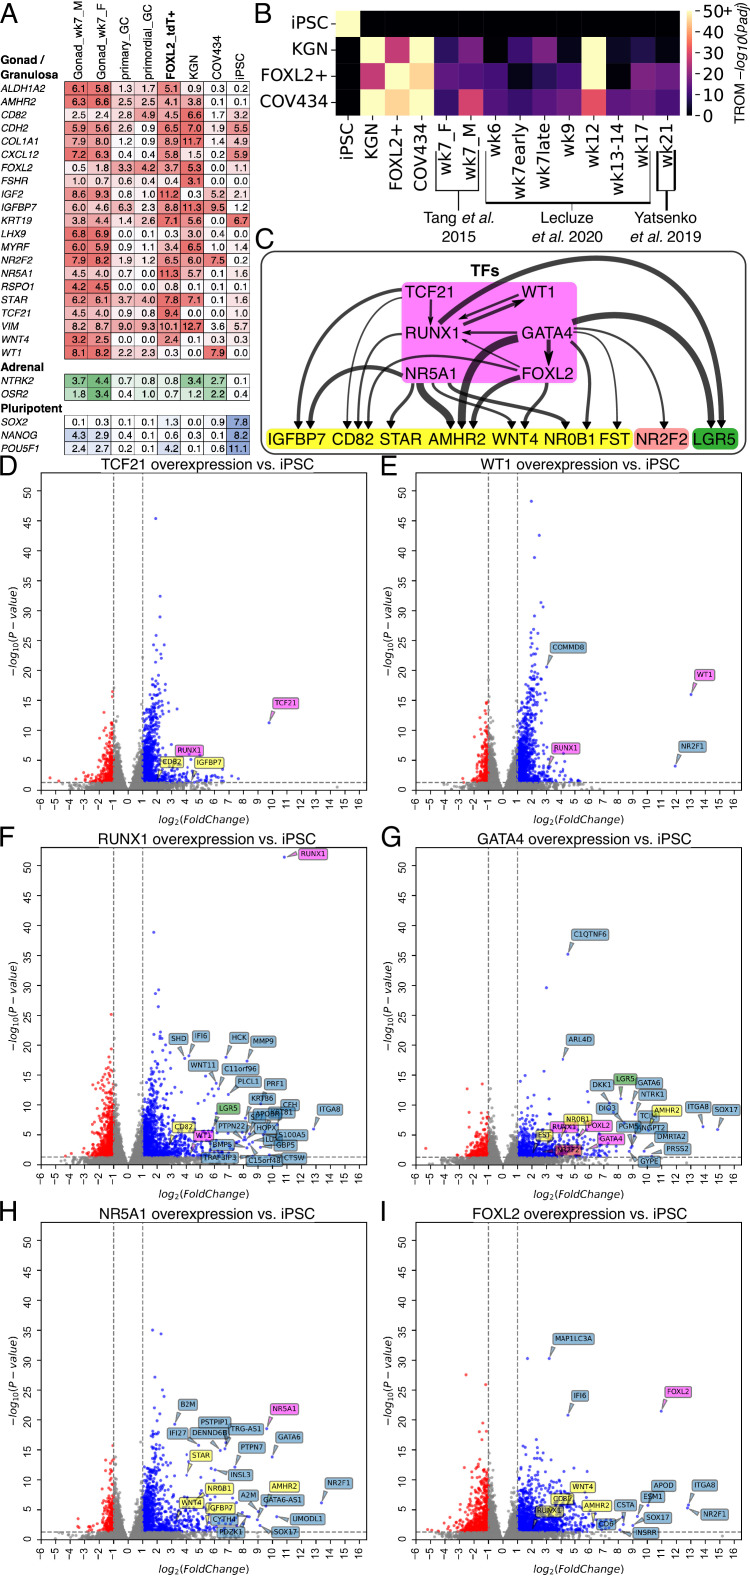
Figure 3—source data 1. Gene expression data from bulk RNA-seq.
Figure 3—source data 2. List of monoclonal human induced pluripotent stem cell (hiPSC) lines used for granulosa-like cell production.

Figure 3.

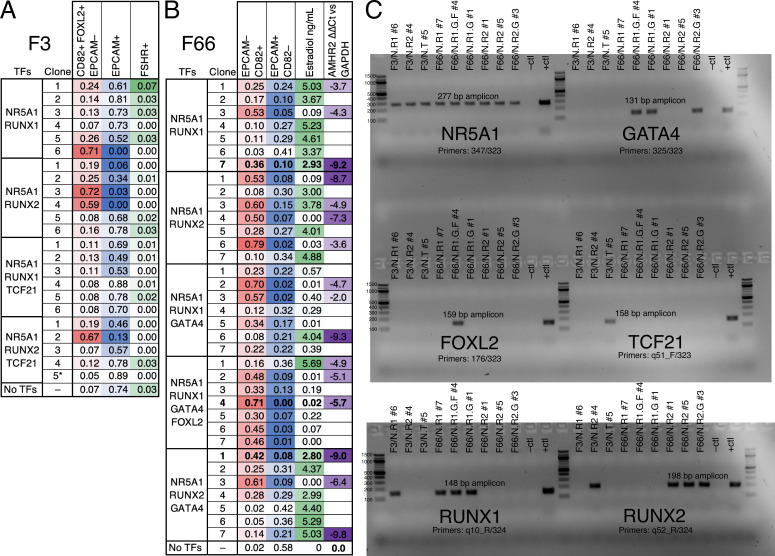
Figure 3—figure supplement 1. Evaluation of monoclonal human induced pluripotent stem cell (hiPSC) lines for yield and quality of granulosa-like cells.

Figure 3—figure supplement 1.

(A) Lines generated by integrating the indicated transcription factor (TF) expression vectors into the F3/FOXL2-T2A-tdTomato hiPSC reporter line were evaluated by flow cytometry for FOXL2, CD82, EPCAM, and follicle-stimulating hormone receptor (FSHR). Note that line F3/N.T #5 lacks the RUNX2 expression vector (see panel C). (B) Lines generated by integrating the indicated TF expression vectors into the F66 wild-type hiPSC line were evaluated by flow cytometry for CD82 and EPCAM, as well as for estradiol production and qPCR to measure AMHR2 expression (the no-TF control was used as a reference for calculating ∆∆Ct). (C) Genotyping to detect integrated TF expression vectors in selected lines. The negative control was wild-type F66 gDNA, and the positive control was gDNA plus TF Library #1. Primer sequences are listed in Supplementary file 1.
Figure 3—figure supplement 1—source data 1. Flow cytometry data and raw gel scans.
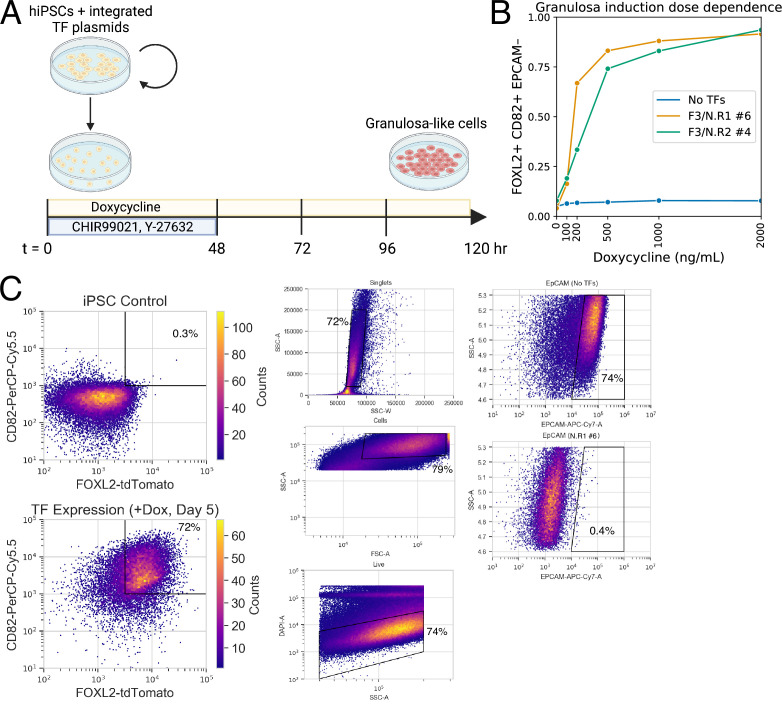
Figure 3—figure supplement 2. Monoclonal human induced pluripotent stem cell (hiPSC) lines with integrated transcription factors (TFs) allow the efficient production of granulosa-like cells in response to doxycycline.

Figure 3—figure supplement 2.

(A) Method of inducing granulosa-like cells from hiPSCs. Vertical black bars represent media changes. (B) Dose dependence for the production of FOXL2+CD82+EPCAM− granulosa-like cells, shown in two monoclonal lines. Granulosa-like cells are efficiently induced from both clones (but not from control cells lacking TF expression vectors) in a doxycycline-dependent manner. (C) Representative gating strategy to analyze flow cytometry data.
Figure 3—figure supplement 2—source data 1. Flow cytometry data.