. 2023 Jan 10;12:e79111. doi: 10.7554/eLife.79111

Figure 1. Excess of ancient polymorphisms segregating in anatomically modern humans (AMHs).

(A) A schematic representation of derived ‘ancient’ variants (purple) that emerged before the AMH-archaic hominin divergence (and after hominin-chimp divergence), and have remained polymorphic in the AMH lineage. The ancestral variants are indicated as orange, and the derived chimpanzee-specific variants are indicated in light blue. (B) The Speidel et al. and Gravel et al. simulation parameters. Speidel et al. provide parameters that involve varying population sizes for the YRI population. (C) Expected distribution of the proportion of ancient polymorphisms in YRI under different models. Each distribution is labeled with three parameters in the form (AMH-Ne, Archaic-Ne, time since archaic-AMH divergence). The simulations where we used variable effective population size published by Spiedel et al. are indicated by blue color and labeled ‘Var’. The simulations where AMH-Ne is constant are shown in orange, and provide the population size used. The vertical line represents the empirical proportion of ancient polymorphisms in YRI.

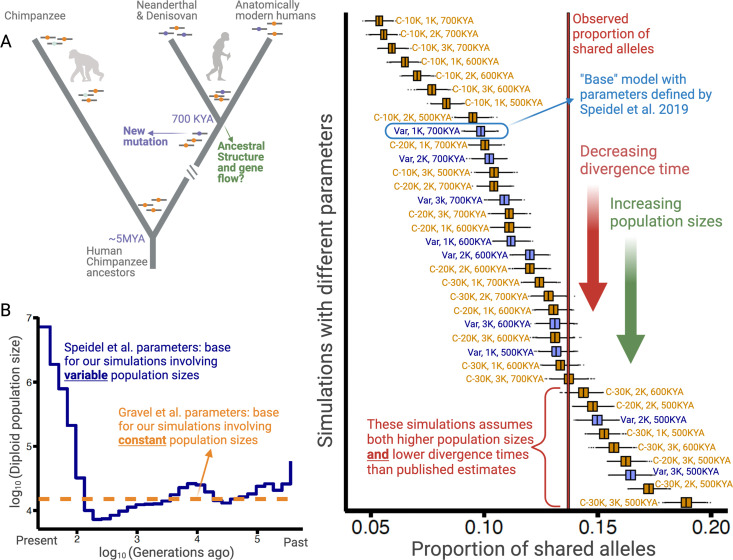
Figure 1.

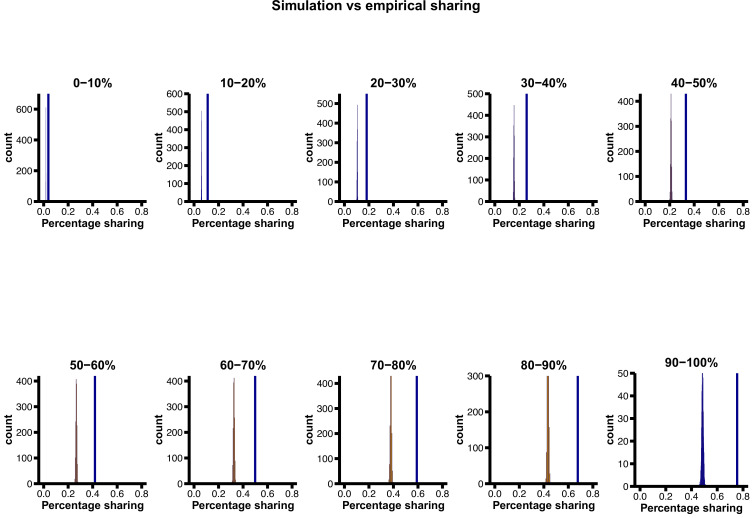
Figure 1—figure supplement 1. Proportion of ancient polymorphisms in observed data (YRI), relative to neutral expectation (‘base’ model parameters) in various derived allele frequency bins.

Figure 1—figure supplement 1.

The vertical blue line indicates the observed sharing, while the distributions are simulated expectations. The excess of ancient polymorphisms in observed data becomes more pronounced at higher derived allele frequencies.
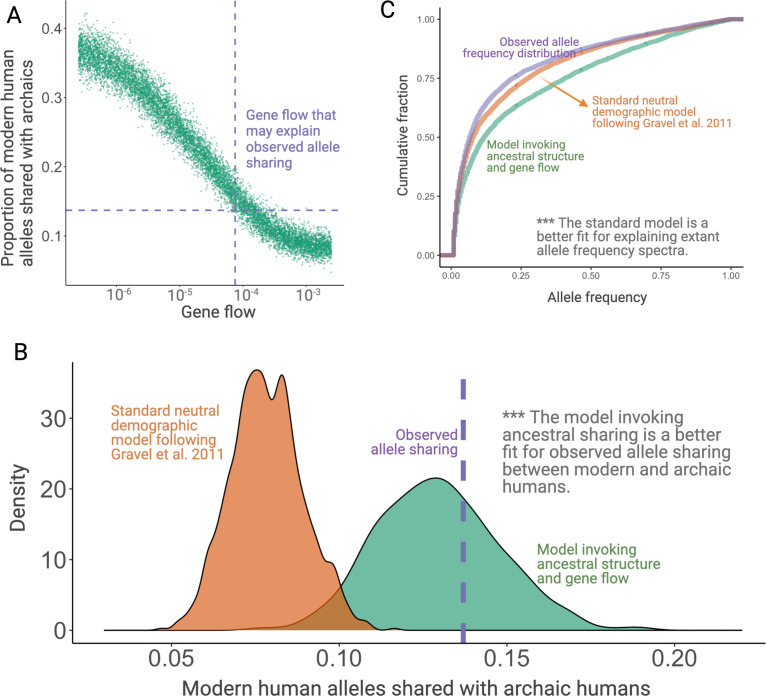
Figure 1—figure supplement 2. Simulation results.

Figure 1—figure supplement 2.

(A) Results from simulations invoking structure in the population that was ancestral to both anatomically modern humans (AMHs) and archaic hominins. In this model, we have three latent subgroups in the ancestral populations. The x-axis refers to the fraction of each subgroup that is formed by the migrants of each of the other subgroups in each generation. (B) Proportion of ancient polymorphisms in YRI. The purple line is the observed proportion of ancient polymorphisms in Yoruba (YRI). The green and orange density plots indicate the distribution of the proportion of ancient polymorphisms in neutral simulations with and without ancestral structure, respectively. We used Gravel et al. parameters for these simulations. (C) Comparison of the allele frequency spectra of simulated single nucleotide variants (SNVs) with observed SNVs. The purple, orange, and green lines represent allele frequency spectra in the YRI population using actual SNVs, neutral simulations without ancestral structure, and neutral simulations invoking ancestral structure, respectively.