. 2023 Jan 10;12:e79111. doi: 10.7554/eLife.79111

Figure 7. Ancient versus non-ancient deletions.

(A) The ratios of sizes of ancient deletions to those of non-ancient deletions at different size percentiles. The black horizontal line refers to the expected ratio of 1.0. Dark orange bars refer to a statistically significant (permutation test) deviation from the expected ratio. Light orange bars mean that the deviation from the extend ratio of 1.0 is not statistically significant. (B) The estimated measure of allele frequency change (χ2) between 50,000 and 5000 years before present in common ancient versus common non-ancient deletions. Ancient deletions have significantly (p=2 × 10⁻⁷, Wilcoxon) higher frequency variability over the last 50,000 years.

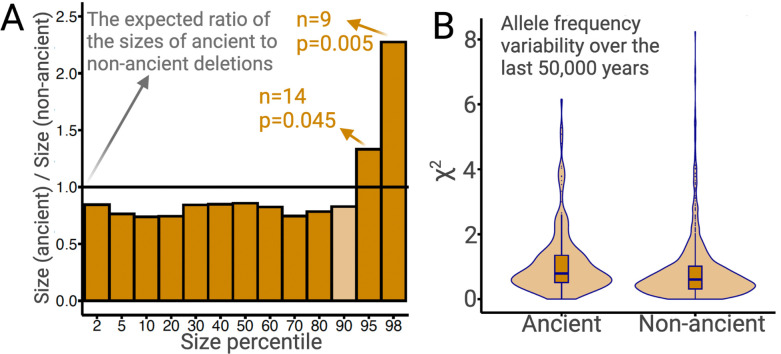
Figure 7.

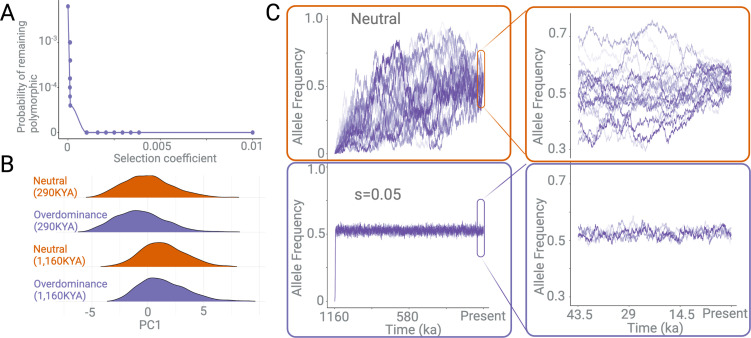
Figure 7—figure supplement 1. Effects of negative selection and overdominance.

Figure 7—figure supplement 1.

(A) The probability of a polymorphism persisting in the population for 1,000,000 years under different negative selection pressures. (B) Density plots of the first principle component of multiple summary statistics based on variants simulated under neutral versus overdominance (s=0.05) scenarios. This is shown for two categories of variants: (1) those that emerged 290 kya and (2) those that emerged 1160 kya. There is no discernible difference between overdominance and neutrality within the time frame of these simulations. (C) The allele frequency trajectories of variants over 1,000,000 years, under neutrally (top), versus under overdominance (bottom). The x-axis represents the time since the emergence of a variant in years, assuming a 29-year generation time. The right panel is a zoomed-in version of the same allele frequency trajectories in the last ~50,000 years.