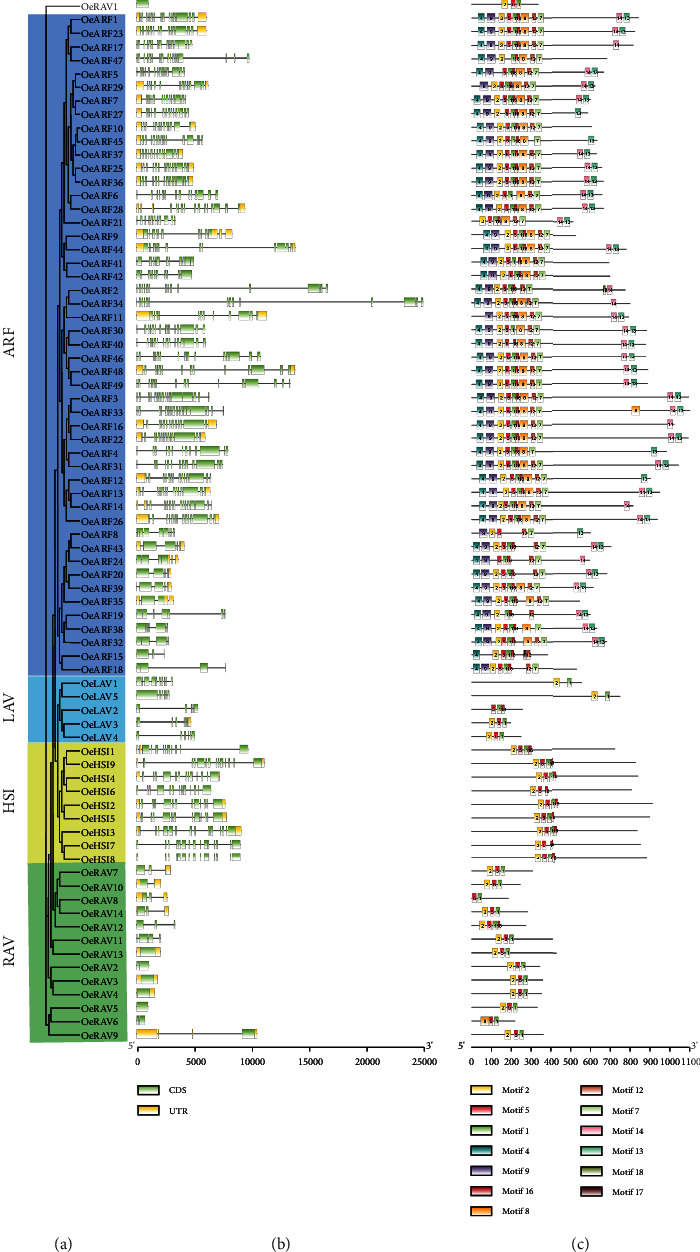
Figure 3.

Structure and motif analyses of the OeB3 genes in the ARF, LAV, HSI, and RAV families in olive. (a) Phylogenetic analysis and classification of a total of 77 OeB3 genes revealed in four families. (b) Gene structure analysis. Yellow boxes represent UTR, light green boxes represent CDS, and black lines indicate the introns. (c) Motif analysis. A total of 20 motifs are displayed and plotted with different colors and motif IDs.
