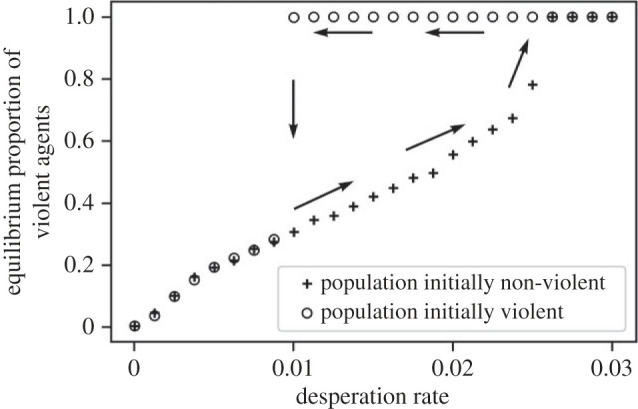
Figure 3.

Proportion of agents playing ‘violent’ or ‘exploiting’ at equilibrium against the desperation rate. The crosses show the data for populations initialized with no violent strategies, and the circles populations initialized with all violent agents. We cut the x-axis when both curves reach 1 (beyond 0.03, crosses and circles stay at 1). The arrows illustrate the hysteresis loop: if a population's desperation rate increases from 0 to 0.04, it would follow the lower branch, but if it decreases from 0.04 to 0, it would follow the upper branch.
