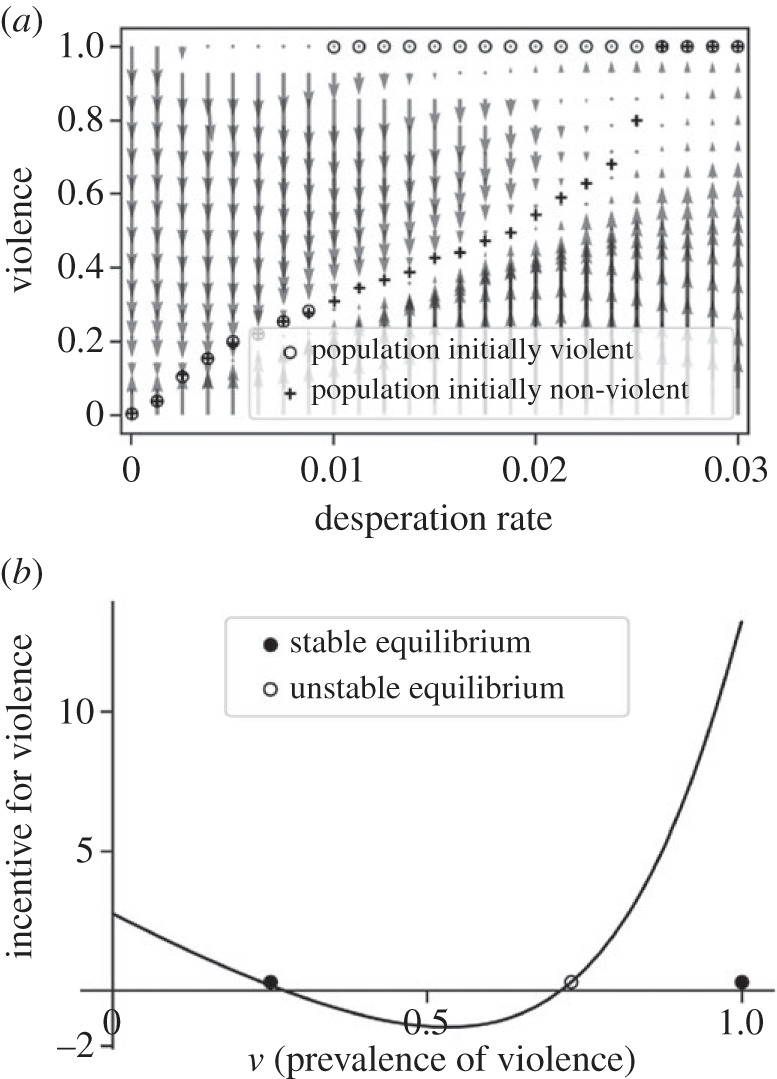
Figure 4.

(a) Vector field representation of the model results. We obtain the vector field numerically, by initializing the population with a certain proportion of violent agents and a certain desperation rate. We let agents update their strategies and the arrows represent how much the proportion of violent agents has changed. For intermediate desperation rates, the vector field reveals a bistable system, explained by (b). (b) Incentives for violence, defined as the mean difference in payoffs between the violent and submissive strategies, obtained with a fixed desperation rate, varying the prevalence of violence. The incentive for violence first decreases as the risk of actually fighting increases, then explodes as the costs of exploitation concentrate on the rare non-violent agents.
