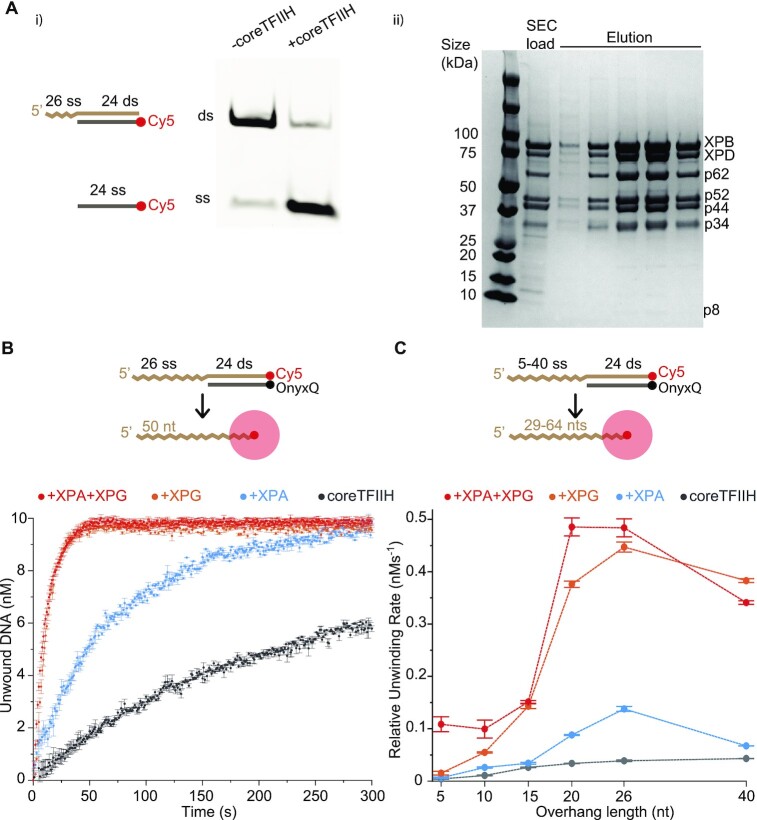
Figure 1.
coreTFIIH unwinding activity is stimulated by XPG, XPA, and longer 5′ overhangs. (Ai) Unwinding activity of coreTFIIH visualized on a native gel using a 5′ overhang substrate after 5 min of incubation at 37°C in the presence of 1 mM ATP. (Aii) Representative Comassie blue stained gel of the final size exclusion column (SEC) load and elution fractions. All coreTFIIH subunits are labelled next to their respective band. The lowest band for P8 stains poorly on a regular basis due to a low number of aromatic residues. (B) Fluorescence intensity time plots showing coreTFIIH unwinding activity in the presence of XPA and/or XPG. Values obtained from linear fits of the linear region are color-coded. (C) Relative unwinding rates are plotted against the 5′ overhang length. Units of the Y-axis (nM) over the X-axis (s) were assigned to the slope (nM·s−1). All data points include the average of three independent experiments. Error bars indicate the standard error of the mean (SEM). See also Supplementary Figure S1.

