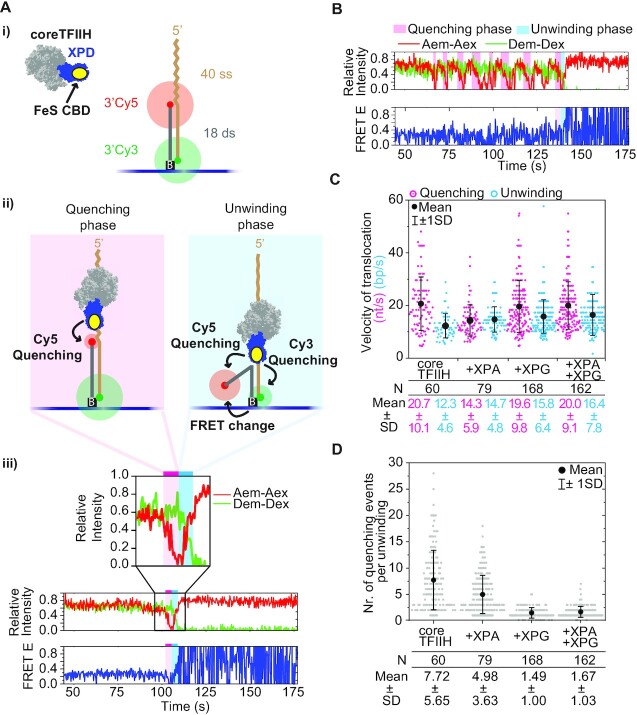
Figure 2.
XPG increases the success of unwinding by reducing abortive translocation at the ss/ds junction. (A) (i) Schematic of the 40ss/18ds substrate with donor (Cy3) and acceptor (Cy5) fluorophores positioned at the 3′ ends and tethered to the functionalized surface via a biotin-neutravidin-biotin link. coreTFIIH subunits XPB, p62, p52, p44, p32, and p8 are shown in light gray. The XPD ATPase is colored blue. The Cy5 and Cy3 fluorophores are colored red and green, respectively. (ii) Schematic representation of the quenching (pink shade) and unwinding (blue shade) phases. coreTFIIH translocation in the 3′ direction along the ssDNA overhang induces Cy5 quenching. During unwinding, coreTFIIH separates the strands of the duplex in the 5′ to 3′ direction as observed through variable quenching of both fluorophores and changes in their FRET E status. (iii) Example trace of a single quenching event followed by an unwinding event. Donor emission intensity due to donor excitation (Dem-Dex), and acceptor emission intensity due to acceptor excitation (Aem-Aex) are overlaid in the upper panel to showcase the anti-correlated behavior during unwinding. (B) Example trace containing multiple quenching events of the acceptor before a single unwinding event. (C) The rate of translocation on ssDNA (nt/s) was calculated from the duration of the quenching phase, along with the rate of strand separation (bp/s) calculated from the duration of the unwinding phase. Different conditions using coreTFIIH alone, or in combination with XPA, XPG, and XPA + XPG are labeled below the plot along with the mean and standard deviation (SD) of the Gaussian distribution to which the data points were fitted. Each dot in the plot represents the rate of a single quenching phase (magenta) that directly preceded the unwinding phase (cyan). After donor loss, oscillation of the FRET E signal between 0 and 1 in the bottom panel reflects trace emissions of Cy5 which periodically cross the detection threshold. These trace emissions are due to a combination of factors such as auto florescence and spectral overlap of the donor and acceptor, and channel leakage. (D) Plot of the number of quenching events that precede an unwinding event. Each dot represents the number of events for a separate trace. N represents the number of dots in each lane of the plots in panels C and D. The mean is indicated with black dots, whereas SD is shown with error bars. The mean, SD values, and the respective data points in the plot are color-coded for easier comparison. See also Supplementary Figures S2 and S3.

