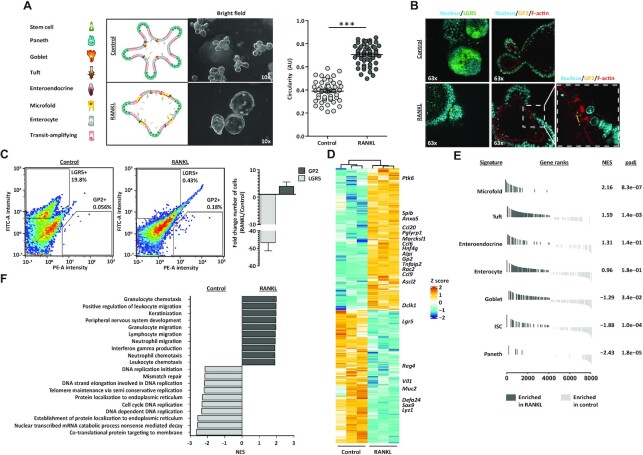
Figure 1.
Generation of M cell-enriched mouse small intestinal organoids. (A) Brightfield images of control and M cell-enriched (RANKL-treated) organoids, next to graphical representation of their cell type composition. Microscope magnification is depicted. Graph shows the quantification of organoid circularity (AU, arbitrary units) and mean ± SEM. Control n = 50 and RANKL n = 51. Unpaired t test P < 0.001 is represented by (***). (B) Nucleus (Hoechst), F-actin (Phalloidin) and GP2 staining and detection of LGR5 signal in control and RANKL-treated organoids. Microscope magnification is depicted. On the right, a zoom in image from the RANKL condition is displayed. (C) Representative density plots depict fluorescent intensities in the FITC (LGR5) and PE (GP2) channels, detected by flow cytometry. The percentage for each gate population is described. Bar graph represents the mean ± SEM of the fold change from at least five differentiation experiments. (D) Heatmap showing the relative change in mRNA expression upon RANKL treatment compared to control. Known markers of M cells and other intestinal cell lineages are displayed. Rows show Z scores of normalized, log2-transformed values from significantly changing genes (Padj < 0.05). (E) Gene-set enrichment analysis showing in vivo gene signatures of mouse small intestine cell lineages from Haber et al. (9) enriched in RANKL-treated organoids compared to control organoids (dark grey). Normalized enrichment score (NES) and padj values are described. Signatures enriched in control compared to RANKL condition (light grey) have a negative NES. (F) Gene-set enrichment analysis showing gene ontology (GO) terms significantly enriched (Padj < 0.05) in control (light grey) and RANKL-treated organoids (dark grey).

