Figure 2.
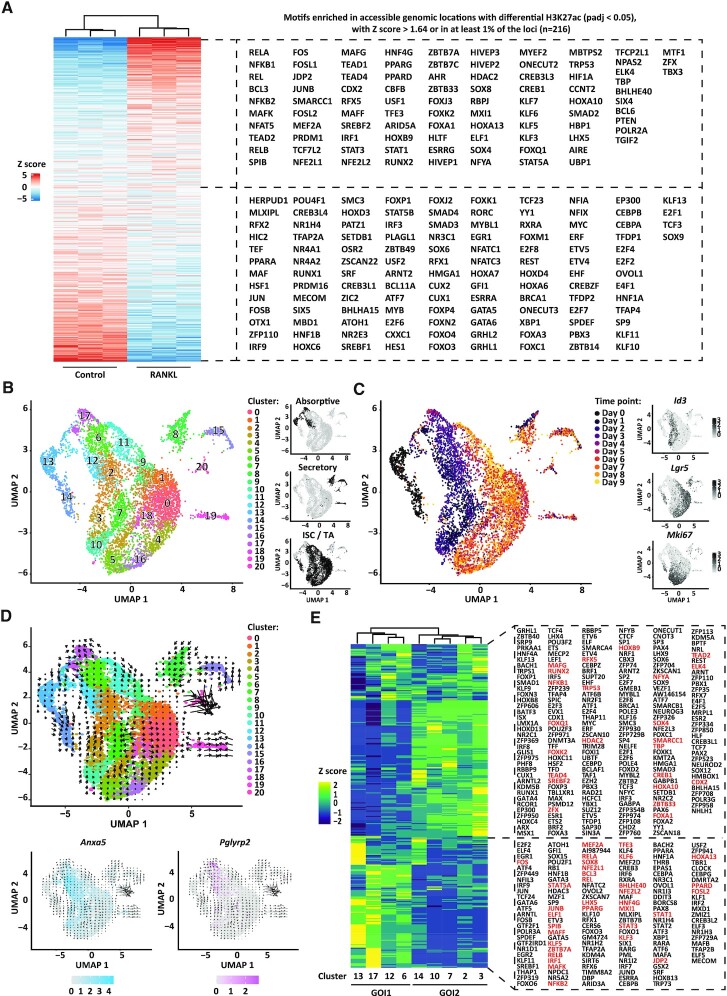
RANKL-induced transcriptional regulation. (A) Heatmap displaying enrichment of transcription factor motifs detected at accessible genomic locations (ATAC-sequencing data) that display significant dynamics of histone modification H3K27ac (ChIPmentation data, Padj < 0.05) between RANKL-treated and control organoids. Only motifs of transcription factors differentially expressed (padj < 0.05) between RANKL-treated and control organoids from the bulk RNA-sequencing data in Figure 1D are included. Rows show z scores of motif enrichment with a cut-off of >1.64 and ←1.64. (B) UMAP embedding of single cell transcriptome from RANKL-treated organoids. Each dot represents a single cell. Cell colours represent cluster identity. Next, highlighted on black the partitions corresponding to cell populations expressing markers of the absorptive or secretory lineages, or markers of intestinal stem cells (ISC) and transit-amplifying (TA) cells. (C) UMAP embedding overlay showing the harvesting time points during differentiation. Next, normalized and natural log-transformed expression of Id3, Lgr5 and Mki67. (D) Velocity projections on UMAP embedding coloured as in (B). Below, normalized and natural log-transformed expression of top markers from cluster 17 (Pglyrp2) and cluster 12 (Anxa5). Velocity projections are shown. (E) Heatmap showing row z scores of regulon activity (area under the curve scores) averaged per each cell population as analysed by pySCENIC. On red, regulons of transcription factors for which an active motif was found in (A). Group of interest 1 (GOI1) and 2 (GOI2) are shown.

