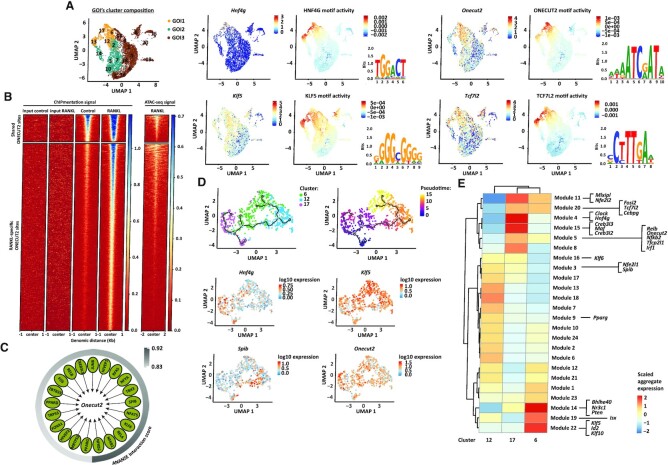
Figure 3.
ONECUT2 signalling in M cell precursor cluster. (A) On the left, UMAP embedding overlay showing three partitions, group of interest 1 (GOI1), 2 (GOI2) and 3 (GOI3). On the right, top four transcription factors expressed within GOI1, with the highest positive correlation between transcript factor expression and motif activity. The logos for the motif of HNF4G (GM.5.0.Nuclear_receptor.0068), KLF5 (GM.5.0.C2H2_ZF.0006), ONECUT2 (GM.5.0.CUT_Homeodomain.0005) and TCF7L2 (GM.5.0.Mixed.0092) are displayed. (B) ONECUT2 ChIPmentation signal and DNA accessibility (from ATAC sequencing) at shared or RANKL-specific ONECUT2 binding sites. From ChIPmentation, heatmap shows one representative replicate for each condition as well as input signal for RANKL and control samples. (C) Gene-regulatory network of Onecut2 drivers predicted by ANANSE. Interaction scores (arbitrary cut-off ≥0.83) are depicted. (D) Trajectory plot overlaid with cluster identity of individual cells from RANKL-treated clusters in GOI1. Three major branches are shown along the plot. On the right, same trajectory plot with cells ordered along a pseudotime. Below, log10 expression values of Onecut2 and top genes from each branching point are shown. (E) Co-regulated modules of differentially expressed genes by cells from RANKL-treated clusters in GOI1. The transcription factors predicted by ANANSE as Onecut2 drivers and ONECUT2 targets, that are differentially expressed (Padj < 0.05) by cells from RANKL-treated clusters within GOI1 and defined as pseudotime-dependent genes are highlighted.

