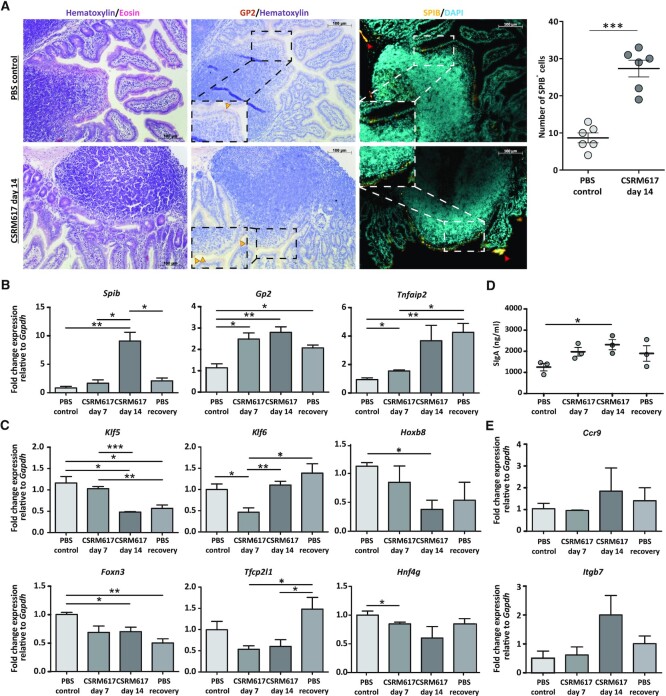
Figure 5.
ONECUT2 regulates M cell number and mucosal immunity in vivo. (A) Immunohistochemistry analysis for GP2 and SPIB protein expression in Peyer's patches of small intestine sections from mice treated with PBS control or CSRM617 for 14 days. Nuclear counterstaining with hematoxylin (bright field) or DAPI (fluorescence) is shown. Scale bars are annotated. Dotted rectangles show amplified areas. Yellow arrow heads show GP2+ cells and red arrow heads mark autofluorescence signal. Quantification of SPIB+ cells from n = 6 Peyer's patches sections from mice treated as in (A). (B) RT-qPCR analysis showing relative mRNA expression of M cell markers Spib, Gp2 and Tnfaip2 in small intestine sections from mice treated as described in Supplementary Figure S3D. Unpaired t test P <0.05 is represented by (*) and P <0.01 by (**). (C) Relative mRNA expression of ONECUT2-targeted genes Klf5, Klf6, Hoxb8, Foxn3, Tfcp2l1 and Hnf4g detected in tissue described in (B). Unpaired t test P <0.05 is represented by (*), P <0.01 by (**) and P <0.001 by (***). (D) Secretory IgA (SIgA) levels in faecal samples from mice treated as described in (B). Unpaired t test P <0.05 is represented by (*). (E) Relative mRNA expression of markers from IgA+ B cells Ccr9 and Itgb7 detected in tissue from (B).

