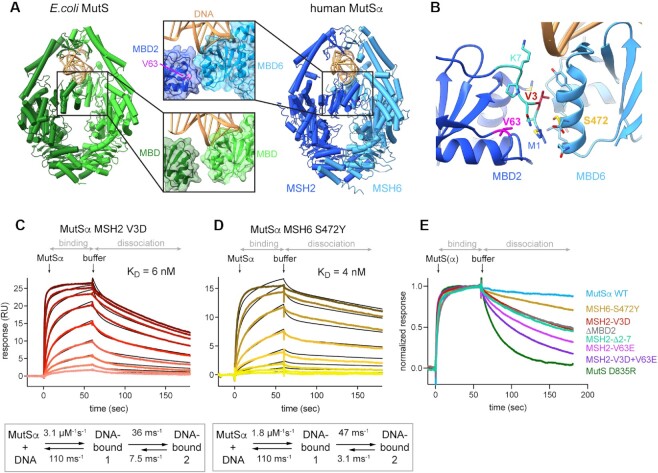
Figure 3.
Interface between the MBDs is responsible for high affinity DNA binding (A) In MutSα, the MBD of MSH2 (dark blue) and MBD of MSH6 (light blue) form an interface. V63 is located in the MBD of MSH2 and highlighted in magenta. It is not involved in DNA binding but part of a hydrophobic network that forms the interface with MBD6. DNA is colored in gold. Escherichia coli MutS, with monomers in light and dark green, has no interface between the MBDs. (B) MBD interface residues and selected mutations. Residues involved in the interface according to PISA are shown as sticks. V3 (red) on MSH2 side points toward MSH6. S472 (yellow) is in the middle of the MSH6 interface helix. MSH2 residues 2–7 are highlighted in cyan. (C, D) SPR mismatch DNA binding profiles of protein titrations ranging from 1 to 256 nM (C) or from 1 to 128 nM (D) in 2-fold dilutions (from light to dark color). Binding and dissociation periods were fitted using CLAMP and values given in scheme below. Curves were fitted with a two-state reaction model (black curves): (C) MutSα MSH2 V3D and (D) MutSα MSH6 S472Y. (E) Comparison of SPR normalized dissociation curves of all tested mutants at 128 nM protein concentration.

