Figure 4.
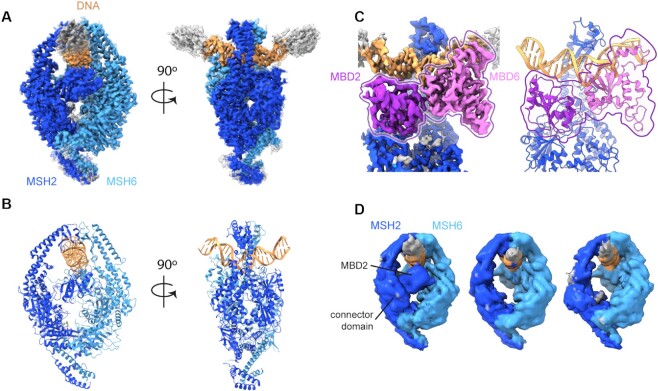
CryoEM structures reveal mobility of MBD2 in V63E. CryoEM density maps and model for MutSα WT and MSH2 V63E. (A) CryoEM map of MutSα WT colored as in Figure 3A. (B) Atomic model of MutSα, colored as in Figure 3A. (C) Map (left) and model (right) of MBD interface with MBD2 in dark purple and MBD6 in light purple for better visibility. (D) The subclasses of the MSH2 V63E dataset show flexibility of the MBD2 domain. Left panel: closed MBD2 reminiscent of MutSα WT; middle panel: disordered MBD2; right panel: disordered MBD2 and dragged-out connector domain.

