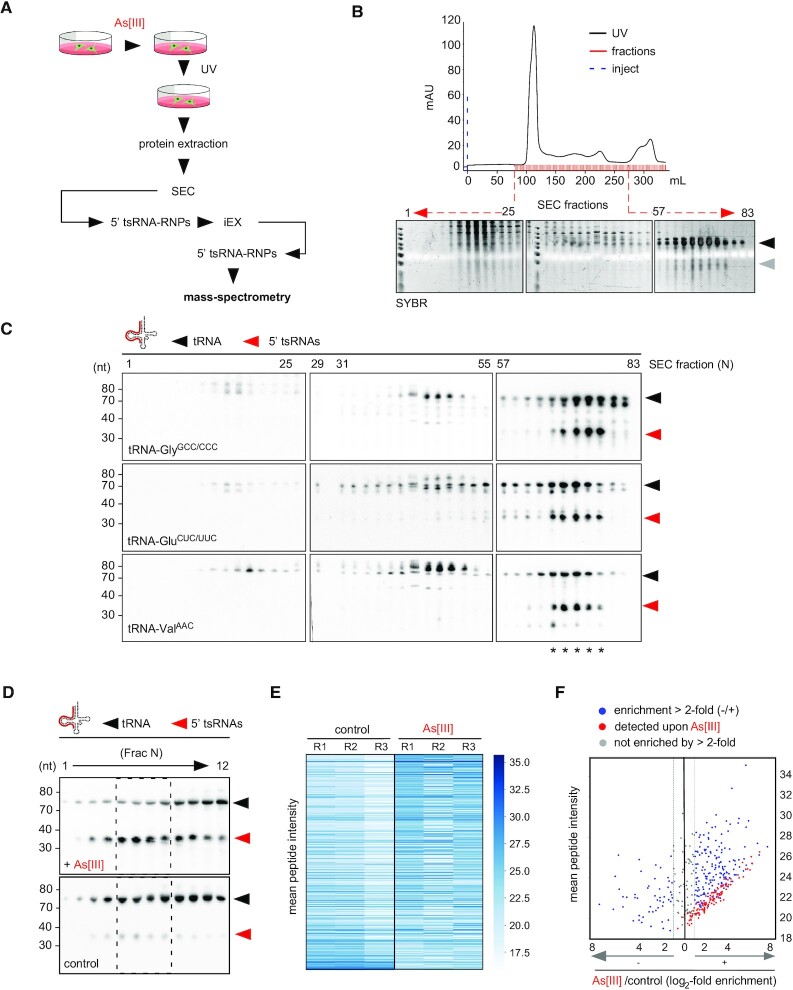
Figure 2.
Biochemical fractionation identifies proteins co-migrating with 5′ tsRNAs after the stress response. (A) Schematic representation of the workflow for the biochemical fractionation resulting in the enrichment and identification of tsRNA-containing RNPs. As[III], inorganic sodium meta-arsenite; UV, ultraviolet light treatment; SEC, size exclusion chromatography; IEX, ion exchange chromatography; RNPs, ribonucleoprotein particles. (B) Representative size exclusion chromatogram for RNPs originating from cell extracts obtained from HEK293 cells after As[III] exposure (black line, UV trace; blue dashed line, injection of sample). RNA from every second fraction of denoted SEC fractions (red marks) was extracted, separated by urea-PAGE and stained with SYBR-Gold; mAU, milli absorbance units; black arrowhead, mature tRNAs; grey arrowhead, small RNAs including tsRNAs. (C) NB of total RNA extracted from representative SEC fractions as shown in (B) using a probe against the 5′ end of tRNA-GlyGCC/CCC, tRNA-GluCUC/UUC and tRNA-ValAAC. Black arrowheads, mature tRNAs; red arrowheads, 5′ tsRNAs; asterisks, SEC fractions that were pooled and further subjected to ion-exchange chromatography. (D) Representative NB of total RNA extracted from fractions (N = 12) that were obtained from subjecting 5′ tsRNA-containing SEC fractions to ion-exchange chromatography (IEX) using a probe against tRNA-GlyGCC/CCC. Upper panel represents a blot obtained after IEX on SEC fractions from cells exposed to sodium meta-arsenite (+ As[III]). Lower panel represents blot obtained after IEX on SEC fractions from control cells. Dashed boxes mark fractions (5–8) that were analysed for protein content by mass spectrometry. Black arrowheads, mature tRNAs; red arrowheads, 5′ tsRNAs. (E) Heat map representing mean peptide intensity values of proteins detected by mass spectrometry across replicate experiments (R1–3) on control and As[III]-exposed protein extracts. Peptide intensity values (y-axis) were sorted in a descending manner according to their log2- transformed enrichment upon As[III] exposure. (F) Scatter plot of proteins identified in IEX fractions. Mean peptide intensities of identified proteins (y-axis) from replicate experiments were plotted against their log2-transformed enrichment after As[III] exposure. Blue dots depict peptides enriched more than 2-fold (log2> 1, represented by vertical grey lines) in controls (log2 < –1) and after As[III] exposure (log2 > 1). Red dots represent peptides specifically detected upon As[III] exposure. Grey dots represent peptides enriched less than 2-fold in both experimental conditions (–1 < log2< 1).

