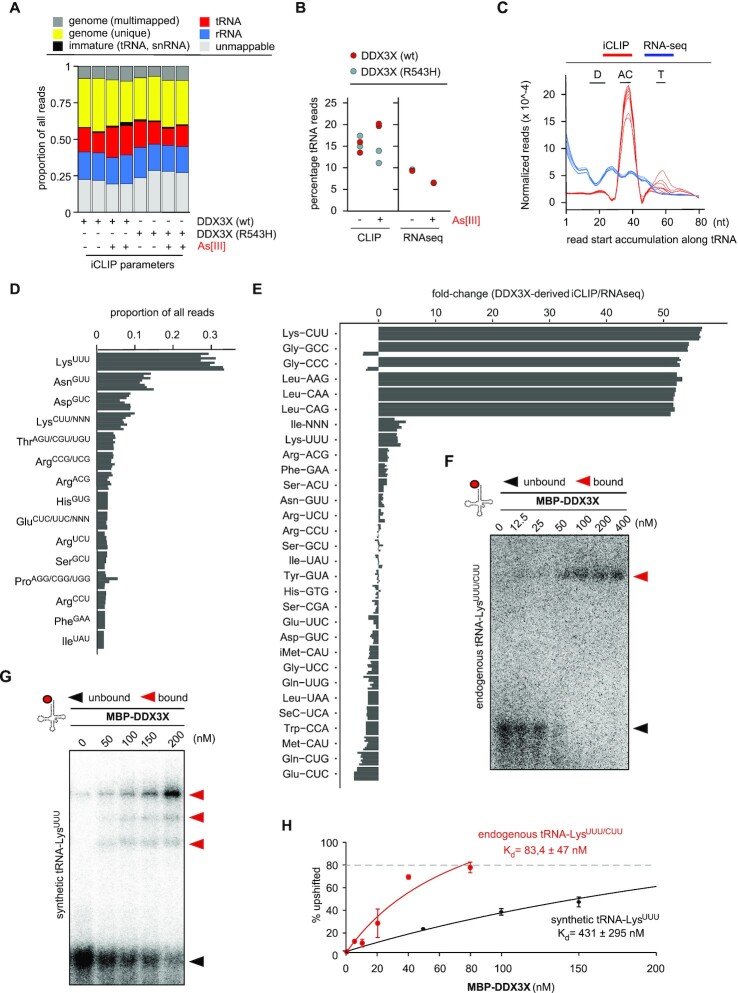
Figure 5.
DDX3X binds to specific tRNAs. (A) Biotype distribution of DDX3X-derived iCLIP reads that were re-analysed from (69). Columns represent duplicate iCLIP experiments using human DDX3X (wildtype, wt) or the catalytic DDX3X mutant (R534H) under steady-state conditions and after As[III] exposure. (B) Changes in DDX3X-mediated iCLIP-derived tRNA reads and in tRNA expression data obtained from duplicate experiments using DDX3X or DDX3X (R534H) during steady-state conditions and after iAs exposure (69). Normalised abundance of tRNA-derived reads from iCLIP (left panel) or whole RNA-sequencing experiments (right panel) are shown. (C) Metaplot depicting positional information of DDX3X-mediated iCLIP signatures on tRNA sequences obtained from (69). The 5′ nucleotide positions from individual tRNA-derived reads were determined using all human tRNA genes and plotted against their abundance (red). As a comparison, tRNA-derived reads from total RNA-seq data are shown (blue). Individual lines represent replicate experiments. Letters indicate the positions of D-, anticodon- (AC) and T- loops within tRNA sequences. (D) Plot representing normalised abundance of DDX3X-derived iCLIP reads obtained from each experiment described in (69) and after mapping deposited data to tRNA-derived sequences. Individual rows at each tRNA isoacceptor level represent the proportion of tRNA-derived reads among all mapped tRNA sequences in replicate iCLIP experiments. (E) Plot representing fold-changes (FC) of DDX3X-derived iCLIP read abundance normalised to the RNA-seq read abundance of the corresponding tRNA isoacceptors in HEK293 cells. Individual rows at each tRNA isoacceptor level represent the FC values of corresponding tRNA-derived reads among all mapped tRNA sequences in replicate iCLIP experiments. (F) Representative EMSA after combining increasing molarities of MBP-DDX3X and 5′ end-labelled tRNA-LysUUU/CUU (10 nM final). UV-crosslinked RNPs were separated using nPAGE. Black arrowhead, non-bound tRNAs; red arrowhead, DDX3X-tRNA-LysUUU/CUU complexes. (G) Representative EMSA after combining increasing molarities of MBP-DDX3X and synthetic 5′ end-labelled tRNA-LysUUU sequences (30 nM final). UV-crosslinked RNPs were separated using nPAGE. Black arrowhead, non-bound tRNAs; red arrowhead, DDX3X-tRNA-LysUUU complexes. (H) Quantification of independent EMSA experiments (n = 3) for the calculation of the equilibrium dissociation constant (Kd) between MBP-DDX3X and endogenously purified and 5′ end-labelled tRNA-LysUUU/CUU as well as a synthetic 5′ end-labelled tRNA-LysUUU sequence. Line marks the fit of the mean values (percent of shifted tRNA-Lys signal) to the hyperbolic binding isotherm used to calculate the Kd value while error bars represent standard deviations.

