
Figure 2.
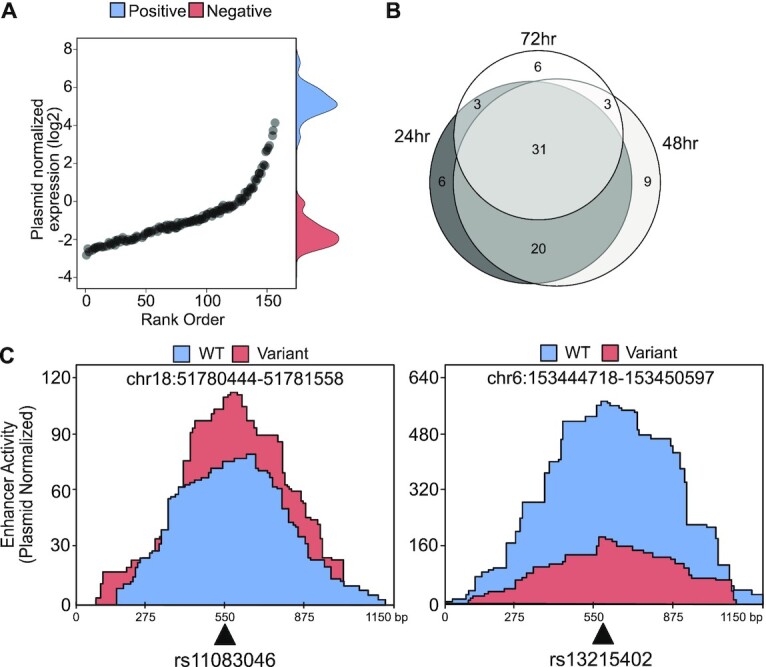
Characterisation of genetic variants that impact enhancer activity. (A) Quality control analysis of 48-hour time point demonstrates the SNP, positive control and negative control capture regions normalized count (mRNA/input DNA) distribution. Each black dot represents a single SNP capture region, whereas the density plot on the right-hand side represents the control capture regions (blue = positive control, red = negative control). (B) NBR model was used to determine SNPs with significant bi-allelic activity. As a result of the calculation, 78 unique SNPs were found among all time points. The number of overlapping SNPs from each time point is depicted by the Venn diagram. (C) Activating (rs11083046) and repressive (rs13215402) SNPs that cause bi-allelic enhancer activity were visualized.