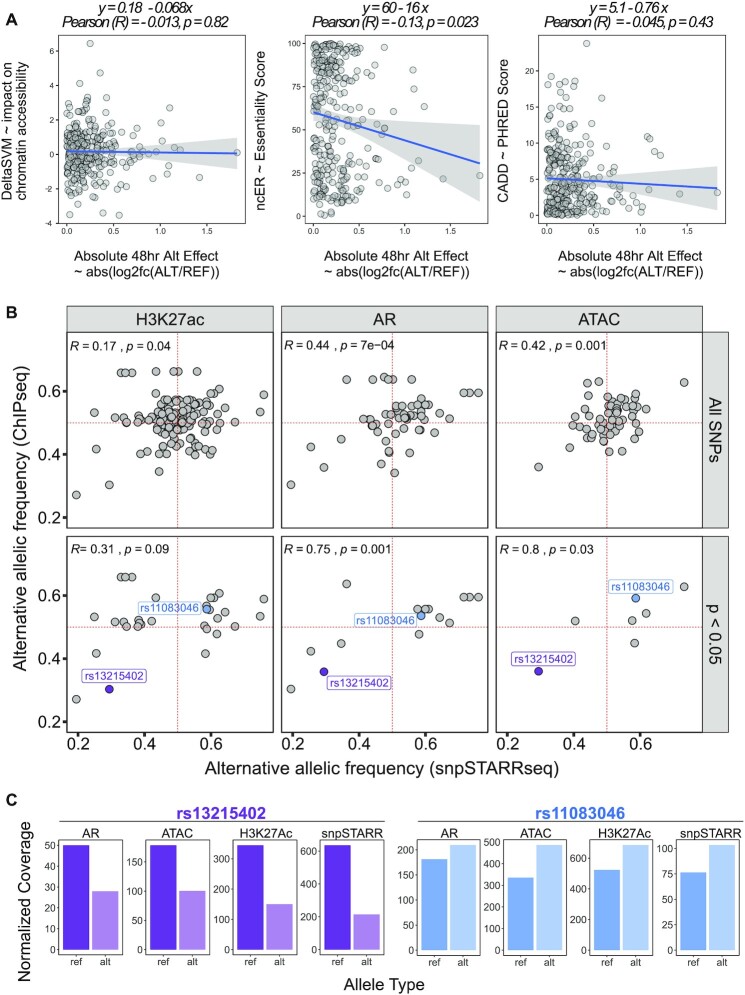
Figure 3.
Comparison of snpSTARRseq to orthogonal methodologies. (A) snpSTARRseq allelic-effects (ALT/REF; Method; Log2FoldChange) was compared to DeltaSVM (Essentiality Score), ncER (Essentiality Score) and CADD (PHRED score) and no significant relation found. (B) snpSTARRseq allele frequency (AF) values were compared against in-vivo AF obtained by H3k27Ac and AR ChIPseq and ATACseq. The top row contains all SNP values without any filtration whereas the bottom row has only significant SNPs found by snpSTARRSeq (nominal p-value < 0.05). Two anecdotal examples of repressive (purple) and activating (blue) SNPs were colored to which were found by all 4 methodologies. (C) SNPs with activating and repressive effects found by previous in vivo work and snpSTARRseq were demonstrated. snpSTARRseq captures the bi-allelic effect of these SNPs accurately.

