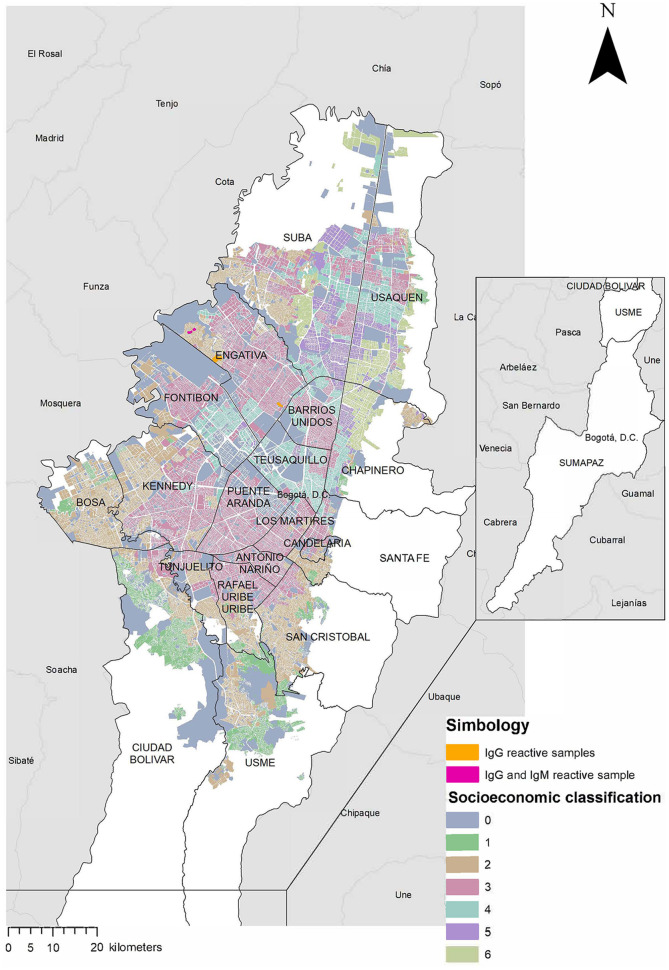
Figure 2.
Neighborhoods in Bogotá with HEV antibody-reactive samples. The map shows the distribution of the localities and their socioeconomic classification. Neighborhoods with HEV IgG-reactive samples are highlighted in orange, the neighborhood with a HEV IgG- and IgM-reactive sample is highlighted in fuchsia.

