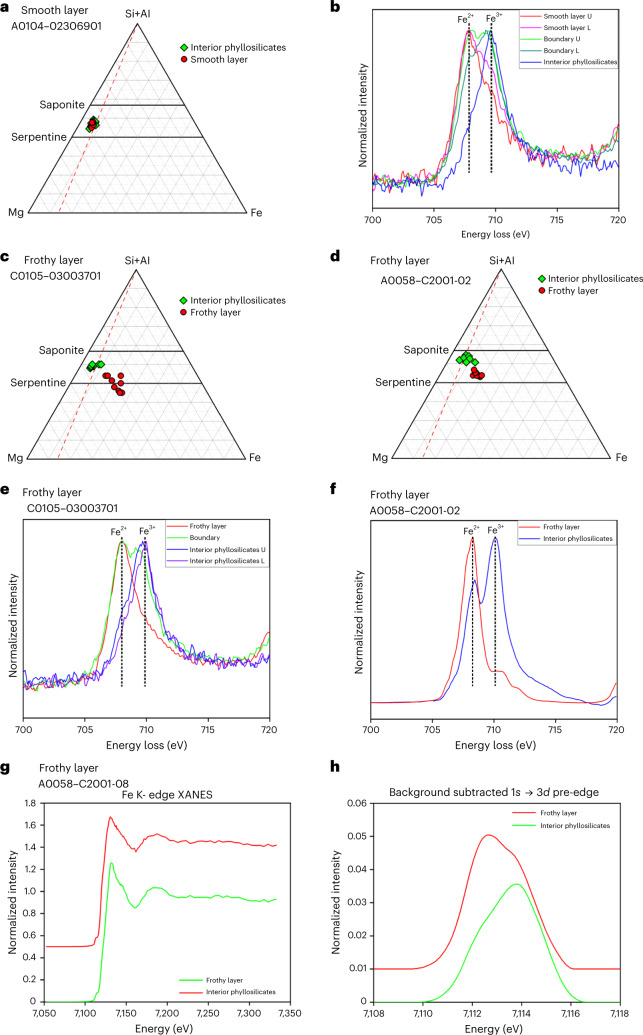
Fig. 3. Elemental compositions and redox states of Fe in a smooth layer, frothy layers and the interior phyllosilicates.
a, The ternary [Si+Al]-Mg-Fe atomic-ratio diagram shows that elemental compositions of a smooth layer are indistinguishable from those of the interior phyllosilicates in the cross-section sample A0104–02306901. b, However, a Fe L3-edge peak in EELS spectra shows that Fe2+ is enriched in the smooth layer, which means that Fe3+ in the smooth layer is reduced to Fe2+. The EELS spectra were obtained from the upper (U) and lower (L) parts of the smooth layers, the upper (U) and lower (L) areas around the boundary between the smooth layer and the interior phyllosilicates, and the interior phyllosilicates. c, By contrast, the frothy layer in the cross-section sample C105–03003700 is more enriched in Fe relative to [Si+Al] and Mg than the interior phyllosilicates. d, The same compositional relationship is shown between the frothy layer in the cross-section sample A0058–C2001 and the interior phyllosilicates. The whole grain sizes of these samples are quite different. C105–03003700 and A0058–C2001 are ~30 µm and ~3 mm across, respectively. e–h, Fe3+ in the frothy layers is also reduced to Fe2+. e, Fe L3-edge peak spectra obtained by EELS. The spectra were obtained from the frothy layer, the boundary area between the frothy layer and the interior phyllosilicates, and the upper and lower areas of the interior phyllosilicates. f, Fe L3-edge peak spectra obtained by STXM–XANES. g,h, Fe K-edge spectra (g) and background-subtracted pre-edge peak spectra (h) obtained by XANES. Int. phyllosilicates, phyllosilicates in the interior of a sample. Serp and Sap in a, c, and d are the abbreviations for serpentine and saponite, respectively.

