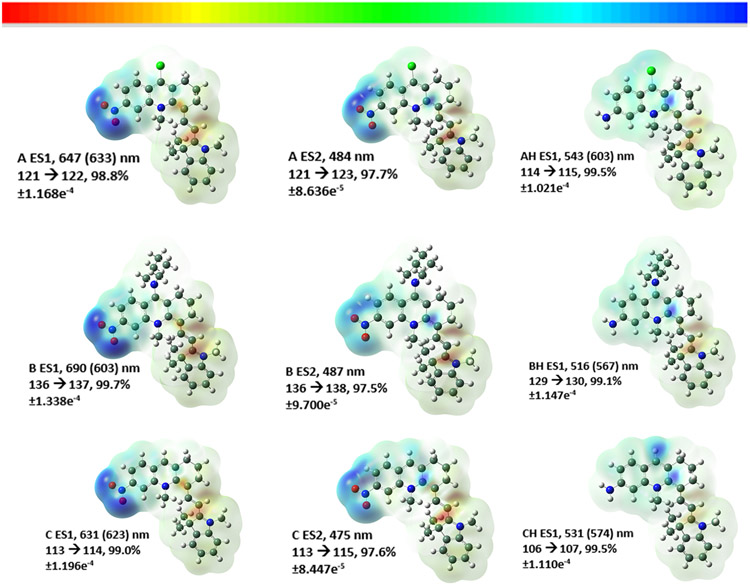
Figure 3.
Diagrams of the electron density variance as 3D surface representations of the probes A (top row), B (middle), and C (bottom) for two excited states (ES) and the reduced forms in the column to the right, respectively. The Supporting Information contains diagrams of the numbered MOs.

