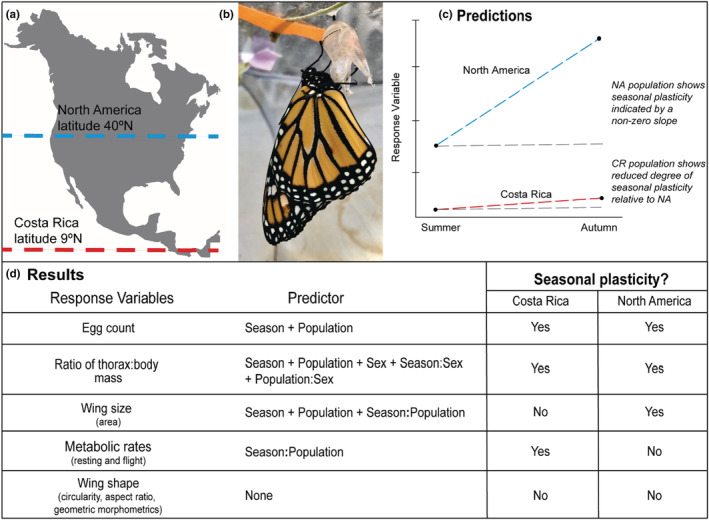
FIGURE 1.

Summary of the experiment, predictions, and main findings investigating seasonal plasticity in Costa Rican (CR) and North American (NA) monarchs. (a) Map of North and Central America indicating NA (blue) and CR (red) monarch respective latitudes. (b) Photo of a newly eclosed monarch butterfly. (c) Prediction and potential outcomes of a possible response variable (i.e., a trait). Populations may differ in trait value regardless of seasonal rearing condition (i.e., a difference in y‐intercept between populations). Populations may also differ in seasonal trait plasticity. A non‐zero reaction norm between summer and autumn trait values within a population indicates the presence of seasonal plasticity (blue and red vs gray lines), and differences in reaction norm between populations indicate differences in degree of plasticity (different slope of blue and red line). (d) List of traits measured in this study, the independent variables (population, rearing season, and sex) that explained significant variance in the trait, and whether each population exhibited seasonal trait plasticity.
