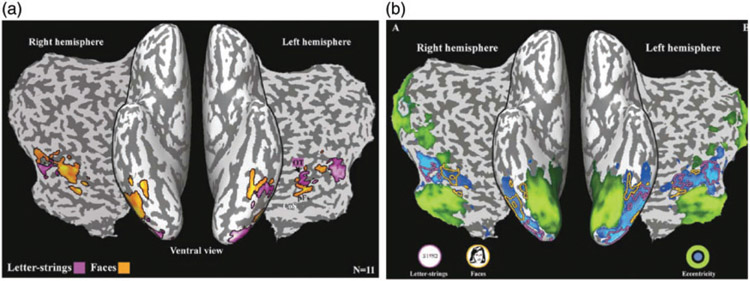
Figure 3.
(a) Activation map showing bilateral activation for faces (orange) and words (mauve) superimposed on both the ventral surface of an inflated brain and on an accompanying flat map. (b) Results of eccentricity mapping in the same individuals. Visual areas responsive to foveally presented images are in blue and to peripheral images in green shown on both the ventral surface of an inflated brain and on an accompanying flat map. Blood-Oxygen-Level-Dependent (BOLD) activation for faces (orange outline) and words (mauve outline) from (a) are superimposed on the eccentricity map and show that both face and word selective activation overlap regions of cortex associated with foveal vision. Adapted with permission from Hasson et al. (2002).

