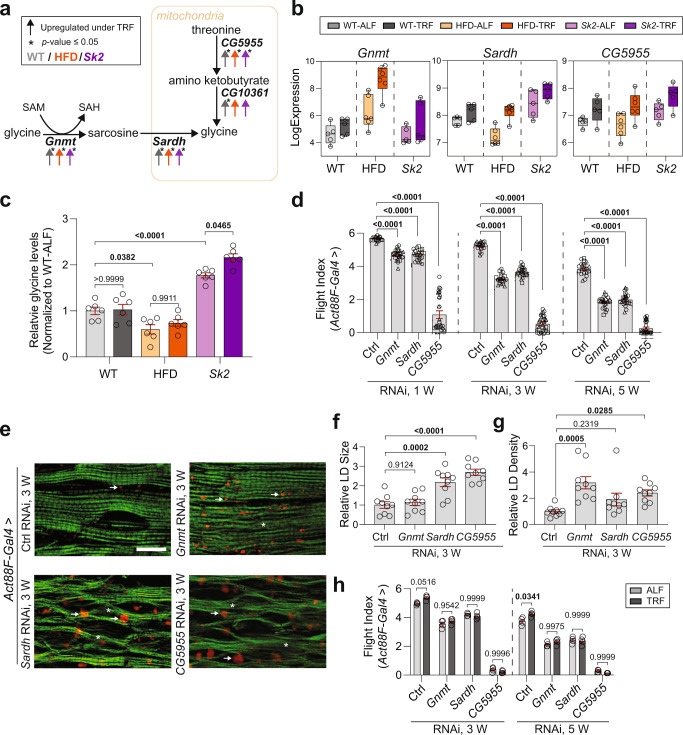
Fig. 2. Functional and cytological assessments of Gnmt, Sardh, and CG5955 KD using Act88F-Gal4.
a Schematic representation of Gnmt, Sardh, and CG5955 connection with metabolite intermediates and important genes (italic bold) encoding enzymes. The color indicates the condition (gray WT, orange HFD, purple Sk2). Up arrows indicate upregulation of gene expression under TRF versus ALF (fold change ≥1.25). Asterisks indicate p-value ≤ 0.05. b Expression level of gene Gnmt, Sardh, and CG5955 under ALF and TRF in WT, HFD, and Sk2 models. N = 5 time points in WT and Sk2. N = 6 time points in HFD. c Relative glycine levels under ALF and TRF in 3-week-old female WT, HFD, and Sk2 thoraces. N = 6 biologically independent replicates. Mean ± SEM. Two-way ANOVA with Sidak post hoc tests. d Flight performance of female flies with Act88F-Gal4-driven KD of Gnmt, Sardh, or CG5955 at 1, 3, and 5 weeks of age. Two independent control RNAi lines were used (Ctrl). Three independent RNAi lines per gene were tested. Flight indices plotted as cohorts of 10–20 flies from independent RNAi lines were indicated with the symbol circle, triangle, or square. # of cohorts per RNAi line per age group = 7–9; # of flies per RNAi line per age group = 100–170. Details of precise N are in Source Data. Mean ± SEM. One-way ANOVA with Sidak post hoc tests. e Fluorescence images of the cryosectioned IFMs from 3-week-old female flies with Act88F-Gal4-driven KD of Gnmt, Sardh, and CG5955 upon staining with phalloidin (green) and Nile Red (red puncta). More accumulation of lipid (arrows) and actin-containing myofibrillar disorganization (asterisks) was detected in IFMs of KD of Gnmt, Sardh, and CG5955, compared with age-matched control. The scale bar is 20 µm. f, g Intramuscular lipid quantification (lipid droplet size (f) and density (g)). N = 9 from three flies’ IFM per genotype. Mean ± SEM. One-way ANOVA with Sidak post hoc tests. h Flight performance of 3- and 5-week-old female flies with Act88F-Gal4-driven KD of Gnmt, Sardh, and CG5955 under ALF and TRF. As the three independent lines showed similar results in d, one RNAi line per gene was used. Flight indices were plotted as cohorts of 10–20 flies. # of cohorts per age group = 4; # of flies per age group = 53–83. Details of precise N are in Source Data. Mean ± SEM. Two-way ANOVA with Sidak post hoc tests. Source data are provided as a Source Data file.

