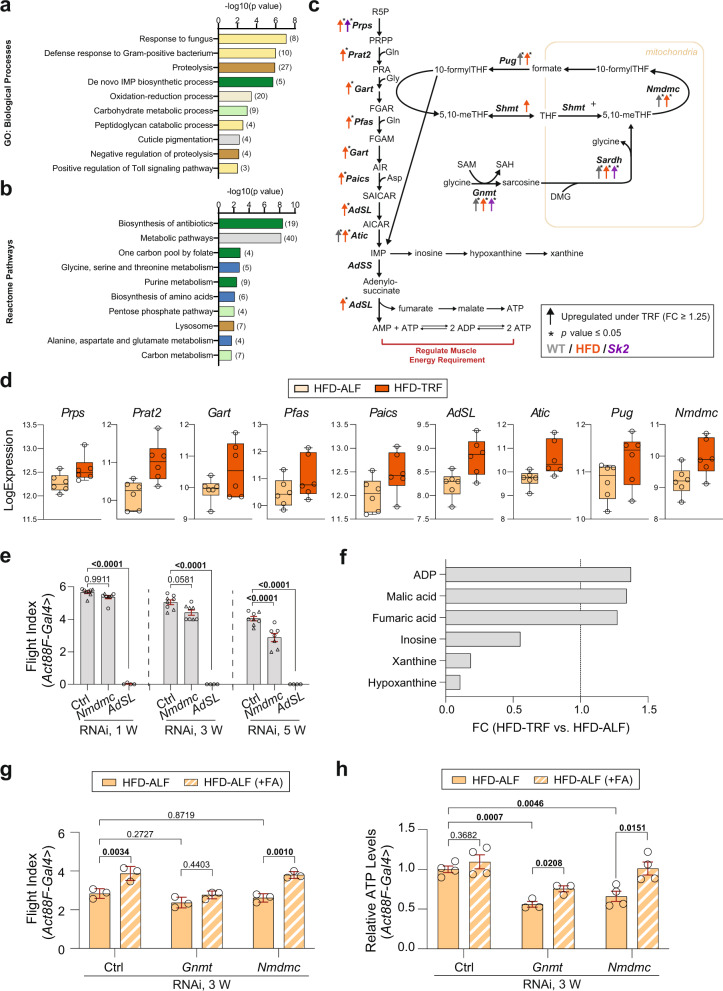
Fig. 5. TRF upregulated genes linked with purine biosynthesis and folate cycle in the HFD model.
a GO analysis and b Reactome pathway analysis of 270 genes that were significantly upregulated under TRF in HFD flies. Bar charts represent the −log10 (p-value) of each enriched GO term and pathway. Related pathways are colored similarly. The number of genes identified in each GO term and pathway is shown in parentheses. c Schematic representation of purine cycle and folate cycle with metabolic intermediates and important genes (italic bold) encoding enzymes possibly involved in energy regulation in muscle. The color indicates condition (gray WT, orange HF, purple Sk2). Up arrows indicate upregulation of gene expression (fold change ≥1.25). Asterisks indicate p-value ≤ 0.05. d Expression level of significantly upregulated genes in the purine cycle and folate cycle under TRF versus ALF in the HFD model. N = 5 time points in WT and Sk2. N = 6 time points in HFD. e Flight performance of control, Nmdmc KD, and AdSL KD using Act88F-Gal4 at 1, 3, and 5 weeks of age in female flies. Two independent lines were tested. Results from AdSL RNAi #1 are shown in Fig. 5e and results from AdSL RNAi #2 are shown separately in Supplementary Fig. 7e due to varying severity of phenotypes and different KD efficiency verified by qRT-PCR (Supplementary Fig. 7d). Flight indices were indicated as cohorts of 10–20 flies. Results from independent RNAi lines were indicated with the symbol circle or triangle. # of cohorts per RNAi line per age group = 4; # of flies per genotype per age group = 51–143. Details of precise N are in Source Data. Mean ± SEM. One-way ANOVA with Sidak post hoc tests. f Metabolites (fold change ≥1.25 under HFD-TRF versus HFD-ALF) associated with the purine cycle. N = 3 biologically independent replicates. g Flight performance of 3-week-old female flies with Act88F-Gal4-driven Gnmt KD and Nmdmc KD under HFD-ALF and HFD-ALF(+FA). FA, folic acid. # of cohorts per genotype per diet = 3; # of flies per genotype per diet = 44–56. Details of precise N are in Source Data. Mean ± SEM. Two-way ANOVA with Sidak post hoc tests. h Relative ATP level measurement in 3-week-old female flies with Act88F-Gal4-driven Gnmt KD and Nmdmc KD under HFD-ALF and HFD-ALF(+FA). N = 3–4 biologically independent replicates per genotype per diet. Mean ± SEM. Two-sided unpaired t-tests. Source data are provided as a Source Data file.

