Fig. 1.
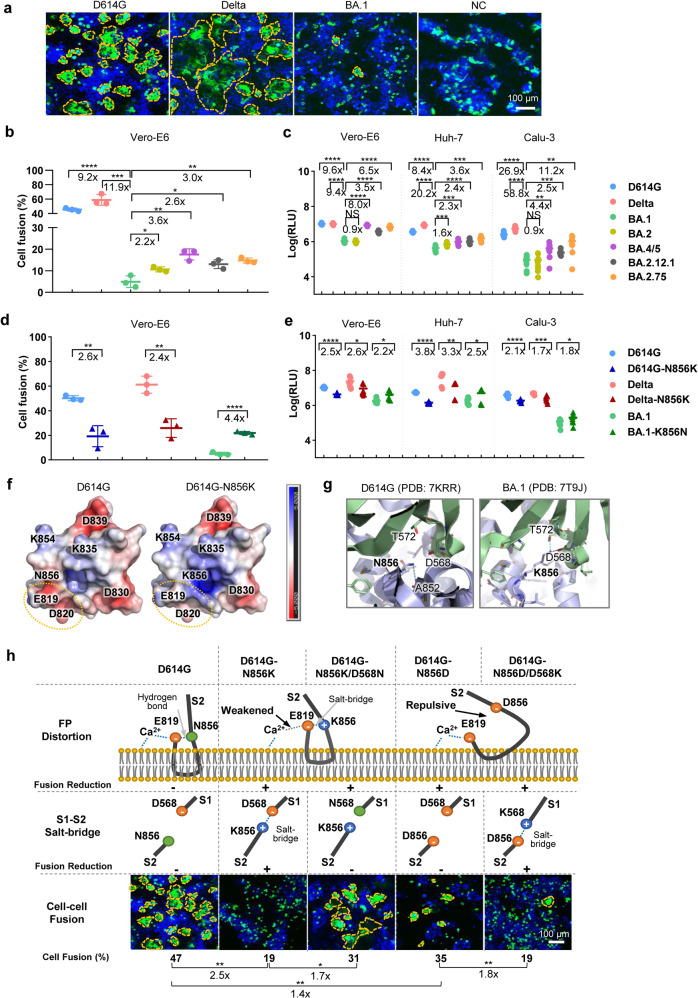
Mutation N856K reduces BA.1 virulence. a S-mediated cell fusion by different SARS-CoV-2 variants. Vero-E6 were used as target cells and co-cultured with HEK293FT effector cells expressing spike-GFP of different SARS-CoV-2 variants or single GFP (negative control, NC) for 48 h. Images were presented as merge of GFP and DAPI signals. Syncytia were highlighted by dotted yellow lines. Scale-bar: 100 μm. b Quantitative analysis of syncytia formation by SARS-CoV-2 variants. The experiments were performed in triplicate and the data were plotted as mean ± SD (n = 3). c PsVs infection signals of SARS-CoV-2 variants. Vero-E6, Huh-7, and Calu-3 cells were infected with the PsVs of SARS-CoV-2 variants at equal viral particles counts at 1E8 for 24 h. The experiments were performed in triplicate and data were plotted as mean ± SD (n = 9). Comparison was made between D614G, Delta, Omicron BA.2, BA.4/5, BA.2.12.1, BA.2.75, and Omicron BA.1, respectively. d Spike mediated cell–cell fusion of D614G and its N856K mutant, Delta and its N856K mutant, Omicron BA.1 and its K856N mutant. e PsVs Infection signals of D614G and its N856K mutant, Delta and its N856K mutant, Omicron BA.1 and its K856N mutant. f Electrostatic potential distribution on the solvent-accessible surfaces of the fusion peptides of D614G and N856K based on the PDB 7MY8 and a modeled structure, respectively. The electrostatic potential distribution was generated using the APBS Tools 2.1 in PyMOL. The surface potential representation has charge levels from −5kT/e (red) to +5kT/e (blue). The circles labeled with yellow lines indicated the binding region of Ca2+. g The interactions between residue 856 and its surrounding residues. The S2 subunits containing residue 856 in one protomer are in blue. The S1 subunits in another protomer are in green. Residues are shown as sticks. The hydrogen-bond and salt-bridge between residue 856 and other residues are shown as dashed lines in sky blue or dark blue, respectively. Superposition of the structures of the N856D/D568K mutant with that of the D614G S2 was superimposed and aligned. The predicted mutant structures were colored in yellow and the salt-bridge interaction between D856 and K568 was shown. h The schematic graphs of speculated structures in FP and S1/S2 interaction by structural analysis or modeling of D614 spike with residue 856 and/or 568 mutation designs and their speculated influences/experimental results on fusion activity. The panel of “FP Distortion” shows the proposed structure of fusion peptide (FP) when the type of residue 856 is asparagine (N), lysine (K), or aspartic acid (D). The panel of “S1-S2 Salt-bridge” shows that whether a salt-bridge was formed between residue 856 in S2 and residue 568 in S1 or not. The “Fusion Reduction” indicates the speculations for weakening fusion activity (+) or not (−). The panel of “Cell–cell fusion” indicated the experimental results of different D614G spike mutation constructs, which was showed by “cell fusion (%)”. Images were shown as merging of the GFP and DAPI signals, scale-bar: 100 μm. Quantitative analysis of cell fusion of different D614G spike mutants was shown below. The experiments were performed in triplicate and the data were plotted as mean (n = 3); Comparison was performed (1) among D614G and its N856 single amino acid mutants designed for verifying the FP disturbance speculation, and (2) between single amino acid mutants and double amino acid mutants designed for S1/S2 interaction speculation. Data analysis was performed by unpaired two-tailed Student’s t-test with or without Welch’s correction for all statistical analyses. *p < 0.05, **p < 0.01, ***p < 0.001, ****p < 0.0001, NS = p > 0.05

