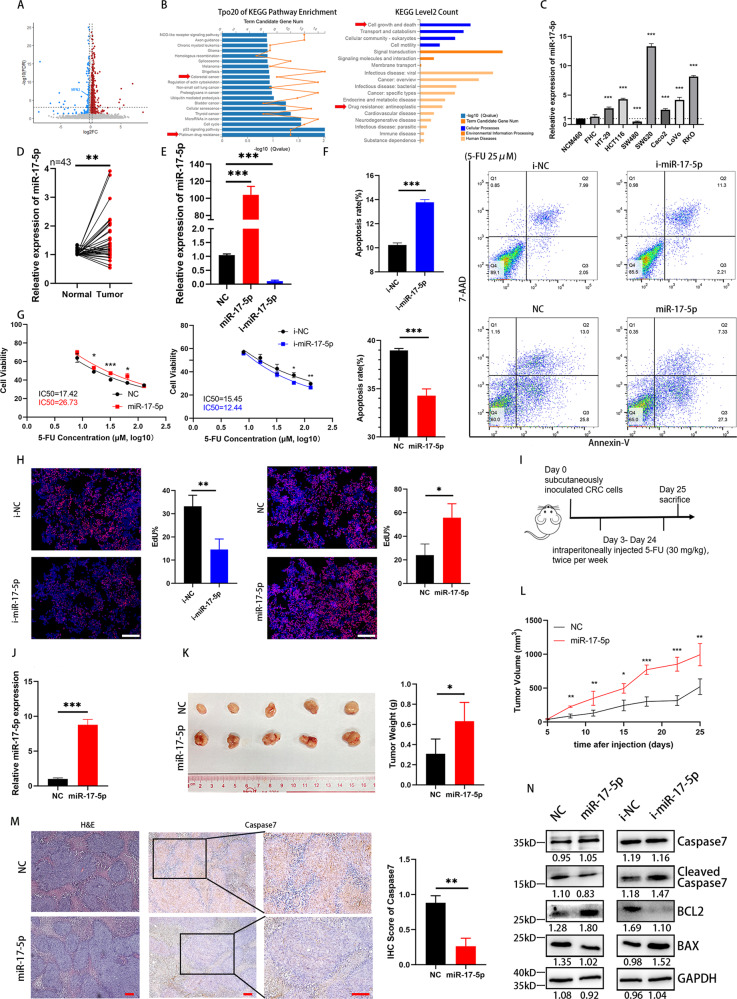
Fig. 1. miR-17-5p reduces the 5-FU-induced apoptosis.
A Up- and down-regulated genes in HCT116 cells after miR-17-5p overexpression. B Top 20 KEGG pathways enrichment and KEGG secondary classification of miR-17-5p-overexpressed HCT116 cells. C Relative expression of miR-17-5p in normal intestinal epithelial cells and CRC cell lines. D Relative expression of miR-17-5p in 43 pairs of CRC tissues from a clinical cohort. P = 0.0019. E Overexpression and knockdown efficiency of miR-17-5p in HCT116 cells. Both P < 0.0001. F Annexin V-PE/7AAD apoptosis assay of HCT116 cells with different miR-17-5p expression levels after 5-FU treatment. P (i-NC vs. i-miR-17-5p) < 0.0001; P (NC vs. miR-17-5p) = 0.0004. G The 5-FU IC50 of HCT116 cells with different miR-17-5p expression levels. H EdU proliferation assay of HCT116 cells with different miR-17-5p expression levels after 5-FU treatment. P (i-NC vs. i-miR-17-5p) = 0.0032; P (NC vs. miR-17-5p) = 0.0106. I Procedure for treatment of xenografted nude mouse models. J Overexpression efficiency of stably transfected miR-17-5p CRC cells. P < 0.0001. K The tumor sizes of xenograft after 6 times 5-FU treatment and the weights in different groups. P = 0.0301. L The changes of tumors volume during the treatment of 5-FU. M H&E and immunohistochemistry analysis of Caspase7 in two groups. P = 0.0021. N Western blot analysis of Caspase7, cleaved Caspase7, BCL2 and BAX protein expression levels in different groups of HCT116 cells treated with 5-FU. Results shown were representative of at least 3 independent experiments. Statistical significance in (D), (F-H), (J-M) was assessed by student’s t-test. Statistical significance in (C), (E) was determined by one-way ANOVA with Dunnett’s multiple comparisons test. *, P < 0.05; **, P < 0.01; ***, P < 0.001. Error bars, SD. Scale bars, 400 μm in (H), 100 μm in (M). The EdU ratio, IHC score and grey value of protein bands have been quantified by Image J.

