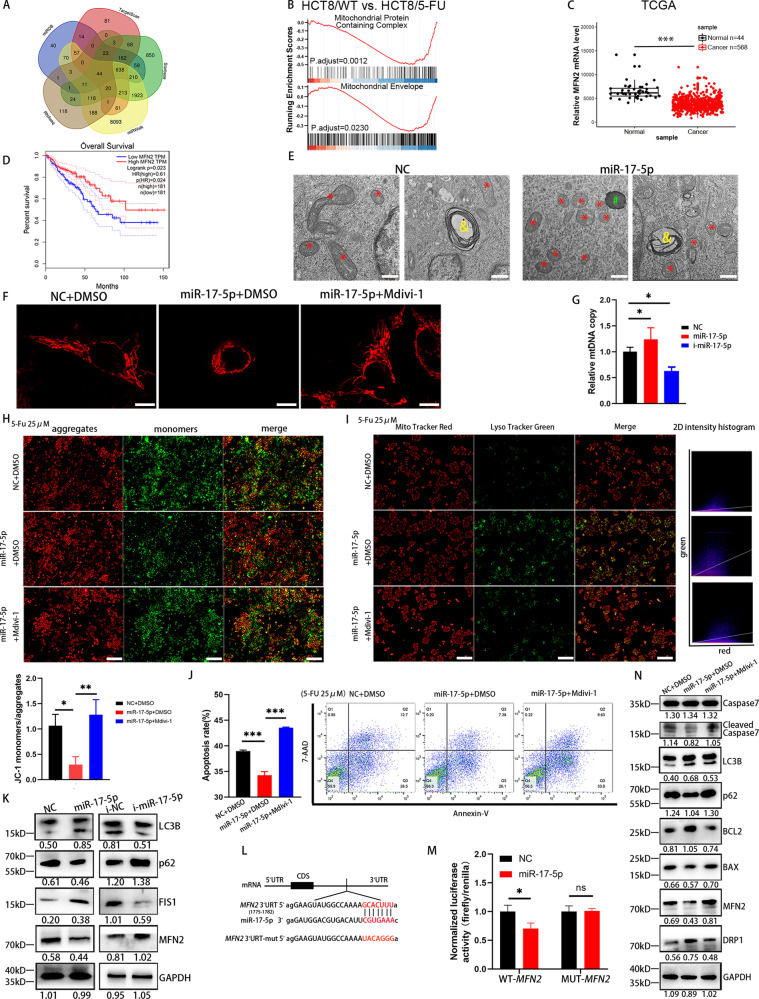
Fig. 2. miR-17-5p reduces the 5-FU-induced apoptosis via mitophagy dynamics and mitophagy.
A The target genes of miR-17-5p were predicted by online databases such as TargetScan, miRDB, miRWalk and StarBase as well as RNA-seq. B Gene set enrichment analysis (GSEA) of GSE81005. HCT8/WT, HCT-8 human CRC wild type cells; HCT8/5-FU, its 5-FU-induced resistant cell line. C Expression of MFN2 in the TCGA CRC cohort. D Analysis of overall survival of MFN2 from GEPIA databases. E Transmission electron microscopy (TEM) images of mitochondria in control cells and miR-17-5p overexpression cells. Red *, mitochondria; green #, lysosomes; yellow &, autolysosome. F Mitochondrial morphology of control HCT116 cells and miR-17-5p overexpression cells with or without Mdivi-1 used under a confocal microscopy. G Relative mtDNA copy of HCT116 cells with different miR-17-5p expression levels. P (NC vs. i-miR-17-5p) = 0.0106; P (NC vs. miR-17-5p) = 0.0424. H Mitochondrial membrane potential was indicated by JC-1 staining. Red fluorescence: JC-1 aggregates, Green fluorescence: JC-1 monomers. P (NC + DMSO vs. miR-17-5p + DMSO) = 0.0120; P (miR-17-5p + DMSO vs. miR-17-5p + Mdivi-1) = 0.0037. I Colocalization (yellow puncta) of lysosomes (Lyso Tracker Green) and mitochondria (Mito Tracker Red). The yellow puncta indicated mitochondria-containing autolysosomes. Manders coefficients for green-to-red colocalization were 0.287, 0.593, 0.340 respectively. J Annexin V-PE/7AAD apoptosis assay of control and miR-17-5p overexpression HCT116 cells with or without Mdivi-1 used. Both P < 0.0001. K Western blot analysis of LC3B, p62, FIS1 and MFN2 protein expression levels in different miR-17-5p expression levels HCT116 cells. L Prediction of miR-17-5p binding site in the 3′UTR region of MFN2 based on TargetScan. M miR-17-5p and a luciferase vector encoding the wild-type or mutant MFN2 3′UTR region were cotransfected into HCT116 cells, the relative luciferase activity was measured. P (WT-MFN2: NC vs. miR-17-5p) = 0.0253. N Western blot analysis of Caspase7, cleaved Caspase7, LC3B, p62, BCL2, BAX, MFN2 and DRP1. Results shown were representative of at least 3 independent experiments. Statistical significance in (M) was assessed by student’s t-test. Statistical significance in (G-J) was determined by one-way ANOVA with Dunnett’s multiple comparisons test. *, P<0.05; **, P<0.01; ***, P<0.001. Error bars, SD. Scale bars, 500 nm in (E), 10 μm in (F), 400μm in (H) and I. The EdU ratio, IHC score and grey value of protein bands have been quantified by Image J, and the grey value of LC3B shown the ratio of LC3II/LC3I.

