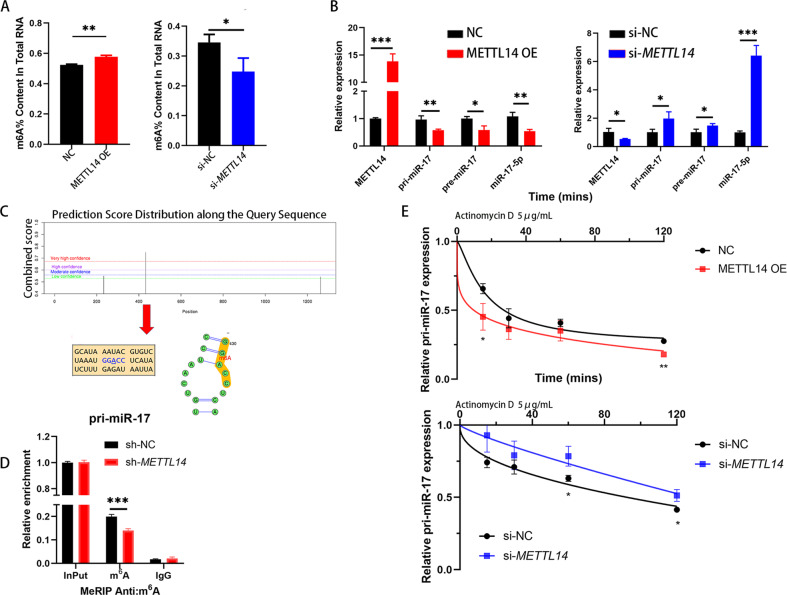
Fig. 4. METTL14 regulates miR-17-5p expression through m6A modification.
A Colorimetric quantification of m6A levels in HCT116 cells after METTL14 knockdown (P = 0.0322) or overexpression (P = 0.0012). B Relative expression of pri-miR-17, pre-miR-17 and miR-17-5p after METTL14 knockdown (P = 0.0335, 0.0313, 0.0322, 0.0002 respectively) or overexpression (P = 0.0001, 0.0084, 0.0121, 0.0049 respectively). C Possible m6A modification sites on the pri-miR-17 predicted by SRAMP database. D MeRIP and MeRIP-qPCR analysis demonstrating pri-miR-17 m6A modification in sh-NC and sh-METTL14 cells, P = 0.0009. E qPCR analysis of pri-miR-17 levels in different HCT116 cells groups after actinomycin D treatment. P (NC vs. METTL14 OE, 15 mins = 0.0272, 120 mins = 0.0021); P (si-NC vs. si-METTL14, 60 mins = 0.0209, 120 mins = 0.0175). Results shown were representative of at least 3 independent experiments. Statistical significance in (A), (B), (D), (E) was assessed by student’s t-test. *, P < 0.05; **, P < 0.01; ***, P < 0.001. Error bars, SD.

