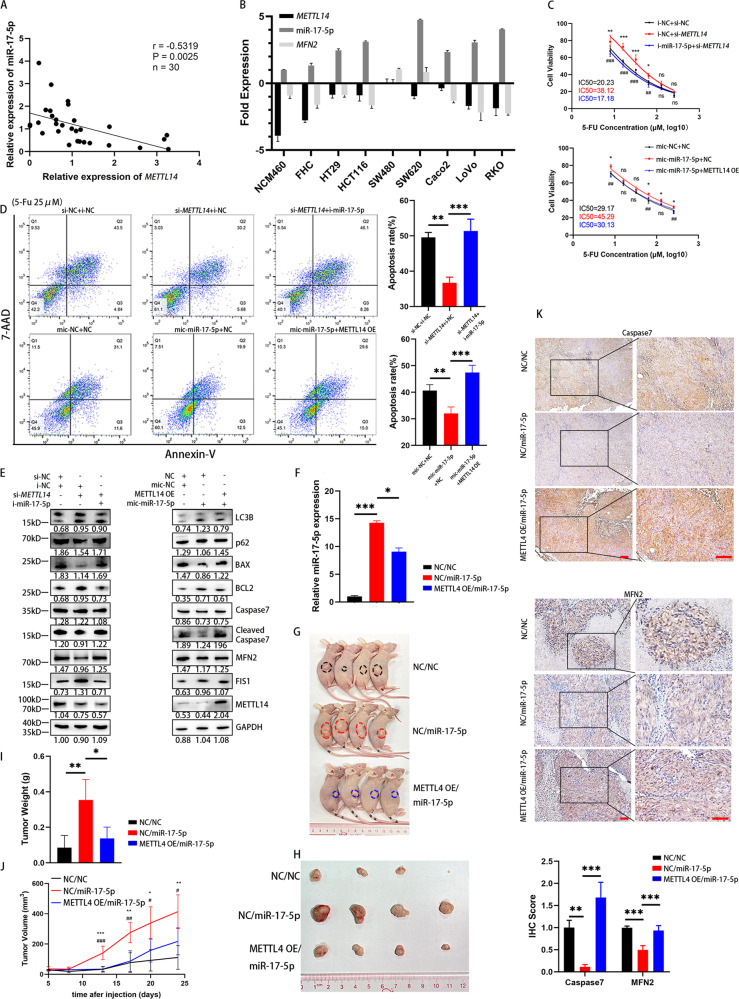
Fig. 6. METTL14 depletion significantly enhances 5-FU resistance via the miR-17-5p/MFN2 axis.
A Correlation between METTL14 and miR-17-5p expression levels in CRC tissues with linear regression lines (n = 30). B RT-PCR analysis of METTL14, miR-17-5p and MFN2 expression levels in normal intestinal epithelial cells and CRC cell lines. C, D Rescue experiments on METTL14 and miR-17-5p: IC50 and Annexin V-PE/7AAD apoptosis of 5-FU in HCT116 cells. In (D), P (si-METTL14 + i-NC vs. si-NC + i-NC) = 0.0010; P (si-METTL14 + i-NC vs. si-METTL14 + i-miR-17-5p) = 0.0005. P (mic-NC + NC vs. mic-miR-17-5p + NC) = 0.0096; P (mic-miR-17-5p +NC vs. mic-miR-17-5p + METTL14 OE) = 0.0005. E Western blot analysis of LC3B, p62, BAX, BCL2, Caspase7, cleaved Caspase7, MFN2, FIS1, METTL14 of rescue experiments. F Transfection efficiency of cell lines with stable co-expression of miR-17-5p and a control vector (NC/miR-17-5p, P = 0.0007) or METTL14 (METTL14 OE/miR-17-5p, P = 0.0190). G Nude mice were implanted with tumor cells subcutaneously. H, I Tumor sizes and weights of xenograft in three groups after 6 times 5-FU treatment. In (I), P (NC/NC vs. NC/miR-17-5p) = 0.0030, P (NC/miR-17-5p vs. METTL14 OE/miR-17-5p) = 0.0111. J The changes of tumors volume during the treatment of 5-FU. K Immunohistochemistry analysis of Caspase7 and MFN2 in three groups. P Caspase7 (NC/NC vs. NC/miR-17-5p) = 0.0049; P Caspase7 (NC/miR-17-5p vs. miR-17-5p/METTL14 OE) = 0.0003; P MFN2 (NC/NC vs. NC/miR-17-5p) ˂0.0001; P MFN2 (NC/miR-17-5p vs. miR-17-5p/METTL14 OE) = 0.0002. Results shown were representative of at least 3 independent experiments. Statistical significance in (A) was assessed by Pearson correlation analysis. Statistical significance in (C), (D), (F), (I), (J-K) was determined by one-way ANOVA with Dunnett’s multiple comparisons test. *, P<0.05; **, P<0.01; ***, P<0.001. Error bars, SD. Scale bars, 100 μm in (K). The IHC score and grey value of protein bands have been quantified by Image J, and the grey value of LC3B shown the ratio of LC3II/LC3I.

