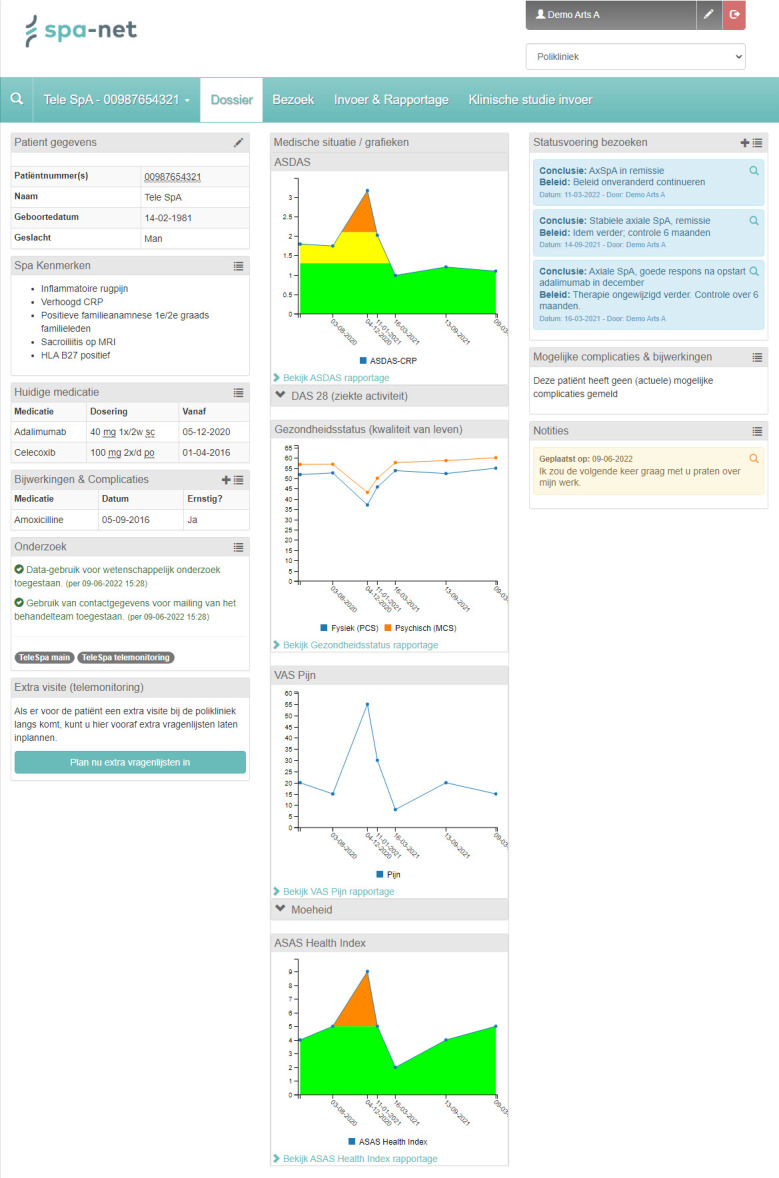
Figure 2.

Example of SpA-Net interface for healthcare providers. For healthcare providers, the SpA-Net dashboard environment is divided into three columns. The first column displays patients’ personal information, presence or history of SpA features, current medication and history of medication-related adverse events. The second column contains graphical summaries of the following ePROMs and disease activity measures: ASDAS, SF-36, VAS Pain, VAS Fatigue (accessible in a drop-down box ‘˅’), ASAS Health index. The third column contains summaries of most recent visits, complications or side-effects reported by patients and patient’s notes or questions. ASAS, Assessment of SpondyloArthritis International Society; ASDAS, Ankylosing Spondylitis Disease Activity Score; CRP, C reactive protein; ePROMs, electronic patient-reported outcome measures; MCS, SF-36 Mental Component Scale; PCS, SF-36 Physical Component Scale; SF-36, 36-Item Short-Form Health Survey; SpA, spondyloarthritis; VAS, Visual Analogue Scale.
