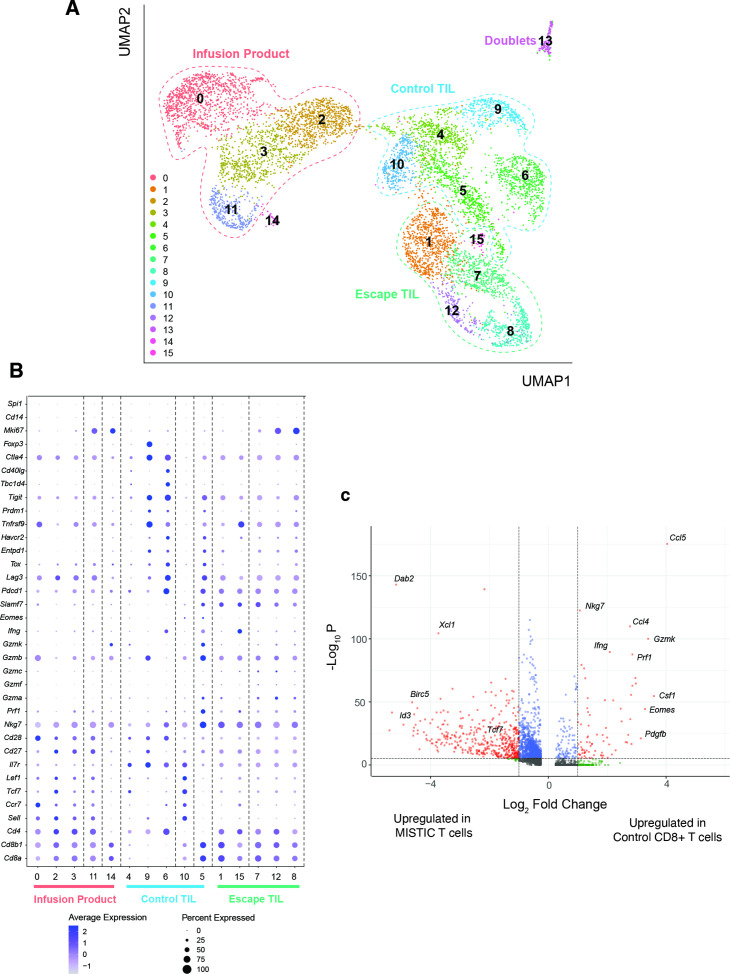
Figure 6.
Single-cell profile of escape tumor-infiltrating lymphocyte (TIL). (A) Uniform manifold approximation and projection (UMAP) dimensionality reduction of the single-cell RNA sequencing (scRNA-seq) data derived from the three indicated populations. The dashed outline delineates the sample each cell derived from. (B) Dot plot of gene expression of select cell-type gene markers. (C) Volcano plot of differentially expressed genes between Mutant Imp3-Specific TCR TransgenIC (MISTIC) T cells in Escape TIL and CD8+ T cells within control TIL.

