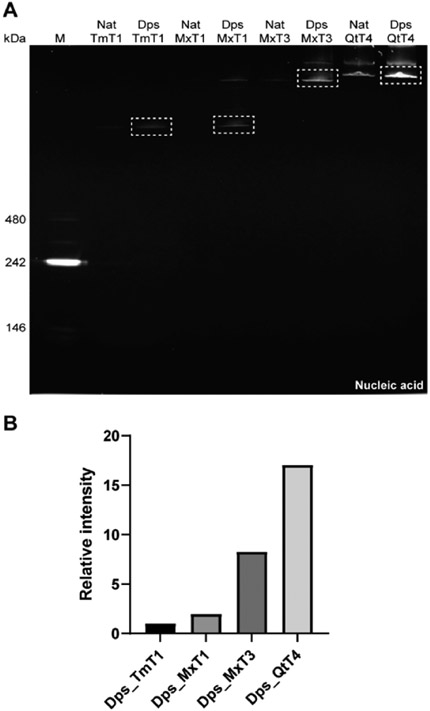
Figure 4.
RNA packaging capacity analysis of differently sized Nat_Encs and Dps_Encs. (A) Native PAGE gel analysis of Nat_Encs and Dps_Encs stained with GelRed to visualize RNA where equivalent amounts of Dps_Encs are loaded (normalized to the number of Dps_Enc shells per lane) across all lanes for comparative analysis. (B) Relative intensity of RNA bands (dotted boxes in A) showing that per Dps_Enc shell, RNA packaging capacity increases with the shell size of Dps_Encs.

