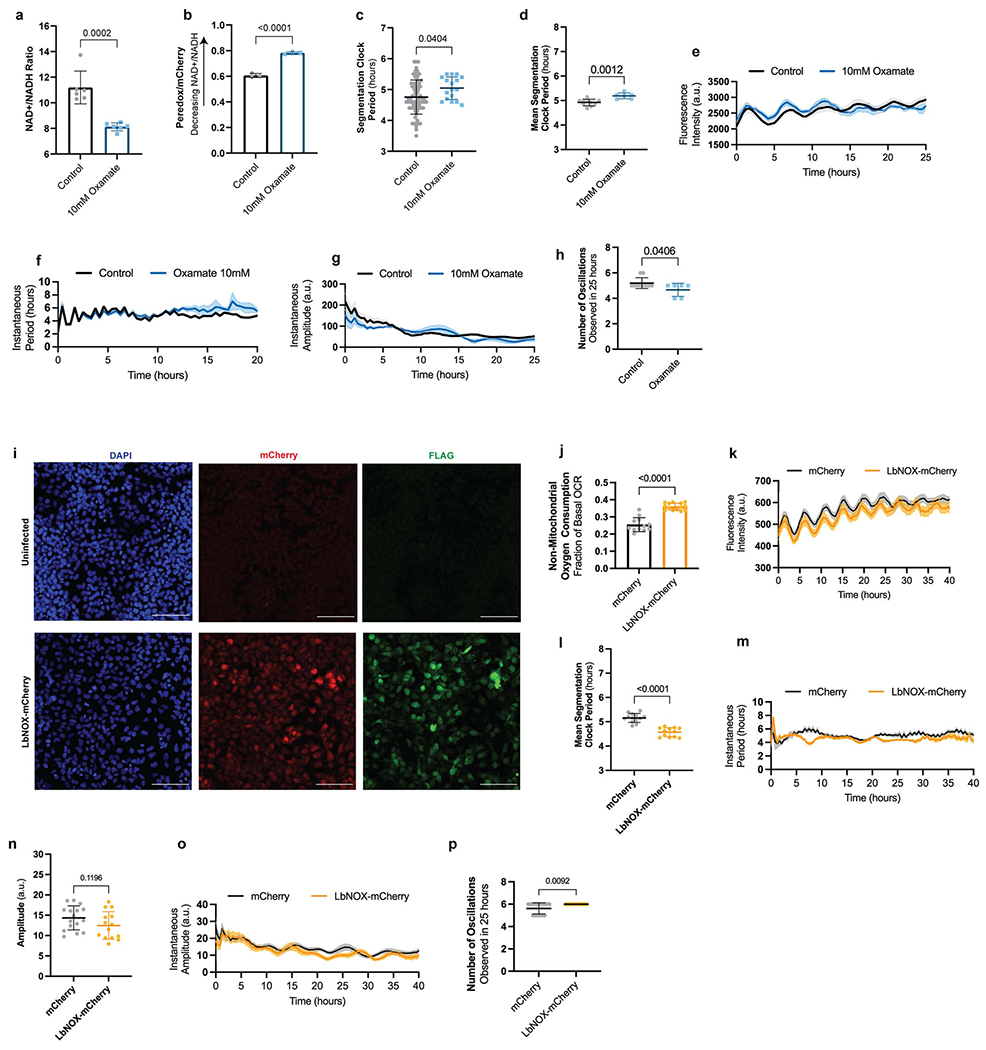
Extended Data Figure 8.

Modulation of the segmentation clock period by direct manipulation of the NAD+/NADH ratio
a. Whole-cell NAD+/NADH ratio human PSM cells under control conditions or treated acutely with 10mM oxamate. Each datapoint represents the average of 3 technical replicates. Mean ±SD. n=6. Unpaired two-sided t-test.
b. Ratiometric Peredox/mCherry signal in human PSM cells cultured under control conditions or treated acutely with 10mM oxamate. Each datapoint represents the average of >200 individual cells analyzed within a biological replicate. Mean ±SD. n=3. Unpaired two-sided t-test, p=8.3x10⁻⁵
c. Period of HES7-Achilles oscillations in human PSM cells cultures treated with water control (n=73) or 10mM sodium oxamate (n=17). Mean ±SEM. Unpaired two-sided t-test.
d. Mean segmentation clock period as calculated by Hilbert transformation for human PSM cells cultures treated with water control (n=10) or 10mM sodium oxamate (n=6). n denotes independent experiments. Mean ±SD. Unpaired two-sided t-test.
e. HES7-Achilles oscillatory profile in human PSM cells cultures treated with water control (n=10) or 10mM sodium oxamate (n=3). n denotes independent experiments. Mean ±SEM.
f. Instantaneous HES7-Achilles oscillatory period over time as calculated by Hilbert transformation in human PSM cells cultures treated with water control (n=10) or 10mM sodium oxamate (n=3). n denotes independent experiments. Mean ±SEM.
g. Instantaneous HES7-Achilles oscillatory amplitude over time as calculated by Hilbert transformation in human PSM cells cultures treated with water control (n=10) or 10mM sodium oxamate (n=3). n denotes independent experiments. Mean ±SEM.
h. Number of HES7-Achilles oscillations observed in 25 hours in human PSM cells cultures treated with water control (n=10) or 10mM sodium oxamate (n=6). n denotes independent experiments. Mean ±SD. Unpaired two-sided t-test.
i. Representative micrographs of DAPI nuclear stain, mCherry endogenous fluorescence, and anti-FLAG immunofluorescence (LbNOX is flag-tagged in the C terminus [28]) in human PSM cells subjected to mock transduction (top) or transduced with LbNOX-mCherry (bottom). Similar results were obtained n=15 times. Scale bar = 100μm.
j. Non-mitochondrial oxygen consumption in human PSM cells transduced with a lentivirus expressing either mCherry alone (n=12) or LbNOX in combination with mCherry (n=14). OCR after addition of 0.5μM rotenone and 0.5μM antimycin A is expressed as fraction of basal OCR. Mean ±SD. Unpaired two-sided t-test: p=1.04x10⁻⁸
k. HES7-Achilles oscillatory profile over the course of 40 hours for human PSM cells transduced with a lentivirus expressing either mCherry alone (n=16) or LbNOX in combination with mCherry (n=14). Mean ±SEM.
l. Mean segmentation clock period as calculated by Hilbert transformation for human PSM cells transduced with a lentivirus expressing either mCherry alone (n=13) or LbNOX in combination with mCherry (n=12). Mean ±SD. Unpaired two-sided t-test: p=4.87x10⁻⁸
m Instantaneous HES7-Achilles oscillatory period over time as calculated by Hilbert transformation in human PSM cells transduced with a lentivirus expressing either mCherry alone (n=13) or LbNOX in combination with mCherry (n=12). Mean ±SD.
n. Mean HES7-Achilles oscillation amplitude in human PSM cells transduced with a lentivirus expressing either mCherry alone (n=16) or LbNOX in combination with mCherry (n=14). Mean ±SD. Unpaired two-sided t-test.
o. Instantaneous HES7-Achilles oscillatory amplitude over time as calculated by Hilbert transformation in human PSM cells transduced with a lentivirus expressing either mCherry alone (n=16) or LbNOX in combination with mCherry (n=14). Mean ±SD.
p. Number of oscillations (peaks) observed in 25 hours for human PSM cells transduced with a lentivirus expressing either mCherry alone (n=16) or LbNOX in combination with mCherry (n=14). Mean ±SD. Unpaired two-sided t-test.
