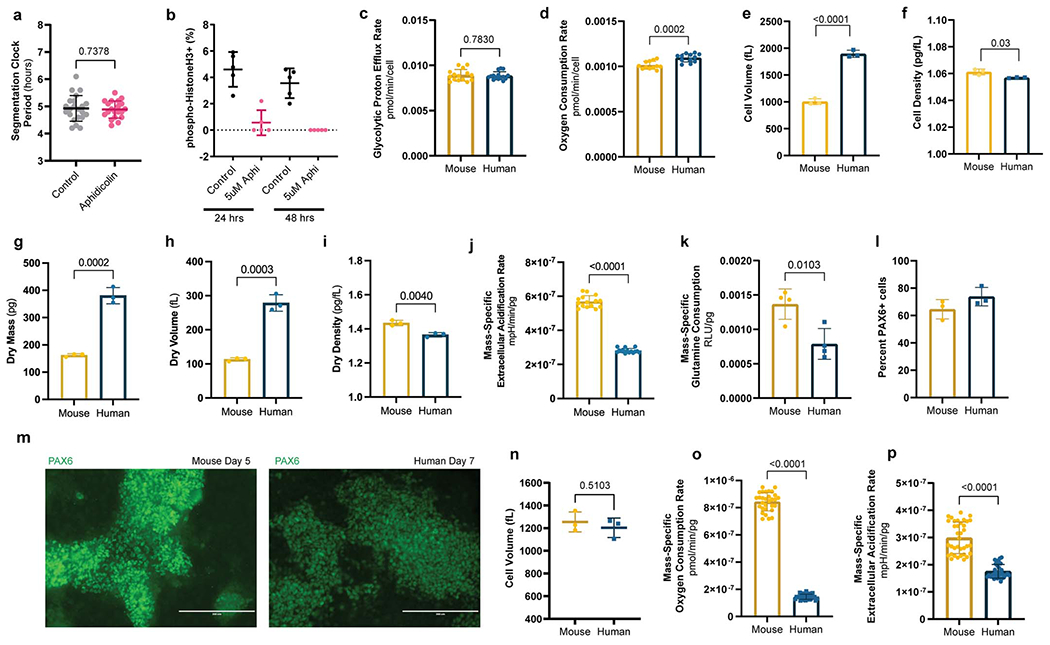
Extended Data Figure 2.

Comparison of metabolic and physical parameters in mouse vs. human PSM and neural progenitor cells
a. HES7-Achilles oscillatory period in human PSM cells under control (DMSO; n=22) or 5μM aphidicolin (n=20) conditions. Cultures were pre-treated with DMSO or aphidicolin for 24 hours to induce cell cycle arrest. Mean ±SD. Unpaired two-sided t-test.
b. Quantification of immunofluorescence staining for histone H3 phosphorylated at Ser10 in human PSM cells treated with vehicle control (DMSO) or 5 μM aphidicolin for 24 or 48 hours. Mean ±SD. n=5 biological replicates.
c. Glycolytic proton efflux rate per cell for MSGN1-Venus+ PSC-derived mouse and human PSM cells. Same data as Fig. 2d but normalized by cell. Mean ±SD. n=15. Unpaired two-sided t-test.
e. Oxygen consumption rate per cell for MSGN1-Venus+ PSC-derived mouse and human PSM cells. Same data as Fig. 2d but normalized by cell. Mean ±SD. n=12. Unpaired two-sided t-test.
f. Total cell volume as measured in a suspended microchannel resonator for MSGN1-Venus+ PSC-derived mouse and human PSM cells. Each datapoint represents the mean of >200 individual cells. Mean ±SD. n=3 independent experiments. Unpaired two-sided t-test: p=5.9x10⁻⁵
g. Total cell density of MSGN1-Venus+ PSC-derived mouse and human PSM cells as measured on a suspended microchannel resonator. Each datapoint represents the mean of >200 individual cells. Mean ±SD. n=3 independent experiments. Unpaired two-sided t-test
h. Dry mass as measured in a suspended microchannel resonator for MSGN1-Venus+ PSC-derived mouse and human PSM cells. Each datapoint represents the mean of >200 individual cells. Mean ±SD. n=3 independent experiments. Unpaired two-sided t-test.
i. Dry volume as measured in a suspended microchannel resonator for MSGN1-Venus+ PSC-derived mouse and human PSM cells. Each datapoint represents the mean of >200 individual cells. Mean ±SD. n=3 independent experiments. Unpaired two-sided t-test.
j. Dry density as measured in a suspended microchannel resonator for MSGN1-Venus+ PSC-derived mouse and human PSM cells. Each datapoint represents the mean of >200 individual cells. Mean ±SD. n=3 independent experiments. Unpaired two-sided t-test.
k. Mass-specific extracellular acidification rate (ECAR) in MSGN1-Venus+ PSC-derived mouse and human PSM cells. Mean ±SD. n=15. Unpaired two-sided t-test: p=8.7x10⁻²³
l. Relative mass-specific glutamine consumption after 12 hours of culture for MSGN1-Venus+ PSC-derived mouse and human PSM cells. Mean ±SD. n=4 biological replicates. Unpaired two-sided t-test.
m. Percent PAX6+ cells in mouse (day 5) and human (day 7) neural progenitor cultures as measured by intracellular staining and flow cytometry. Mean ±SD. n=3 independent experiments.
n. Representative micrographs of immunofluorescence staining for PAX6 in PSC-derived mouse (left) and human (right) neural progenitor cells on days 5 and 7 of differentiation, respectively. Similar results were obtained n=3 times. Scale bar=200μm.
o. Volume of mouse (day 5) and human (day 7) neural progenitor cells as measured by a coulter counter. Mean ±SD. n=3 independent experiments. Unpaired two-sided t-test.
p. Mass-specific oxygen consumption rate for PSC-derived mouse and human neural progenitor cells. Mean ±SD. n=30. Unpaired two-sided t-test: p=1.69x10−51
q. Mass-specific extracellular acidification rate for PSC-derived mouse and human neural progenitor cells. Mean ±SD. n=36. Unpaired two-sided t-test: p=3.75x10⁻¹⁸
