Extended Data Figure 4.

Mitochondrial properties of mouse and human PSM cells
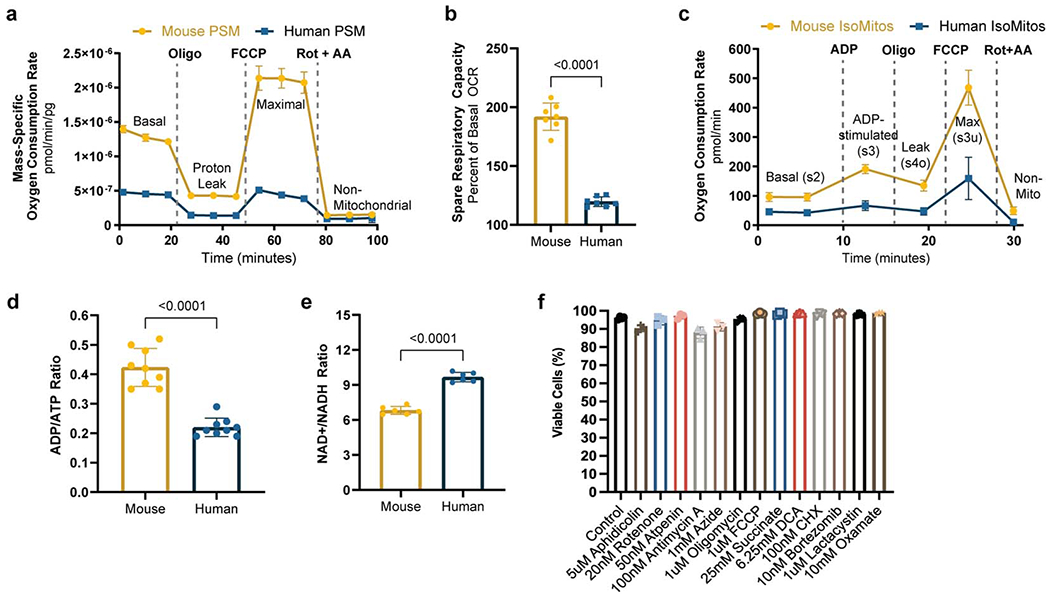
a. Mass-specific oxygen consumption rate measured over the course of the mitochondrial stress test for MSGN1-Venus+ PSC-derived mouse (n=9) and human (n=7) PSM cells. 1μM oligomycin, 1μM FCCP, and 0.5μM Rotenone + 0.5μM Antimycin A were added at the timepoints marked by dotted lines. The first three timepoints denote basal respiration;, respiration after oligomycin addition corresponds to proton leak; FCCP induces maximal respiration; and rotenone/antimycin reveal non-mitochondrial respiration. Spare capacity refers to the difference between maximal and basal respiration rates. Mean ±SD.
b. Spare respiratory capacity in MSGN1-Venus+ PSC-derived mouse and human PSM cells. Mean ±SD. n=7 biological replicates. Unpaired two-sided t-test: p=2.7x10⁻⁹
c. Oxygen consumption rate profiles for mitochondria isolated from mouse and human PSC-derived PSM cells. Rates correspond to 10ug mitochondria seeded per assay well. ETC complex I substrates pyruvate and malate were provided to fuel respiration. 2mM ADP, 5μM Oligomycin, 6μM FCCP, and 1μM Rotenone with 1μM Antimycin A were injected at the timepoints marked by dotted lines. First two timepoints correspond to basal respiration (state 2), followed by ADP-stimulated respiration (state 3), then leak respiration (state 4o), followed by maximal FCCP-stimulated respiration (state 3u), and finally non-mitochondrial respiration. Mean ±SD. n=5 biological replicates.
d. Whole-cell NAD+/NADH ratio in MSGN1-Venus+ PSC-derived mouse and human PSM cells. Each datapoint represents the average of 3 technical replicates. Mean ±SD. n=6 biological replicates. Unpaired two-sided t-test: p=1.2x10⁻⁷
e. Whole-cell ADP/ATP ratio in MSGN1-Venus+ PSC-derived mouse and human PSM cells. Mean ±SD. n=9. Each datapoint represents the average of 3 technical replicates. Unpaired two-sided t-test: p=2.42x10⁻⁷
f. Percent viable cells as measured by trypan blue staining in human PSM cells treated with the indicated inhibitors for 24 hours. n=3 independent experiments.
