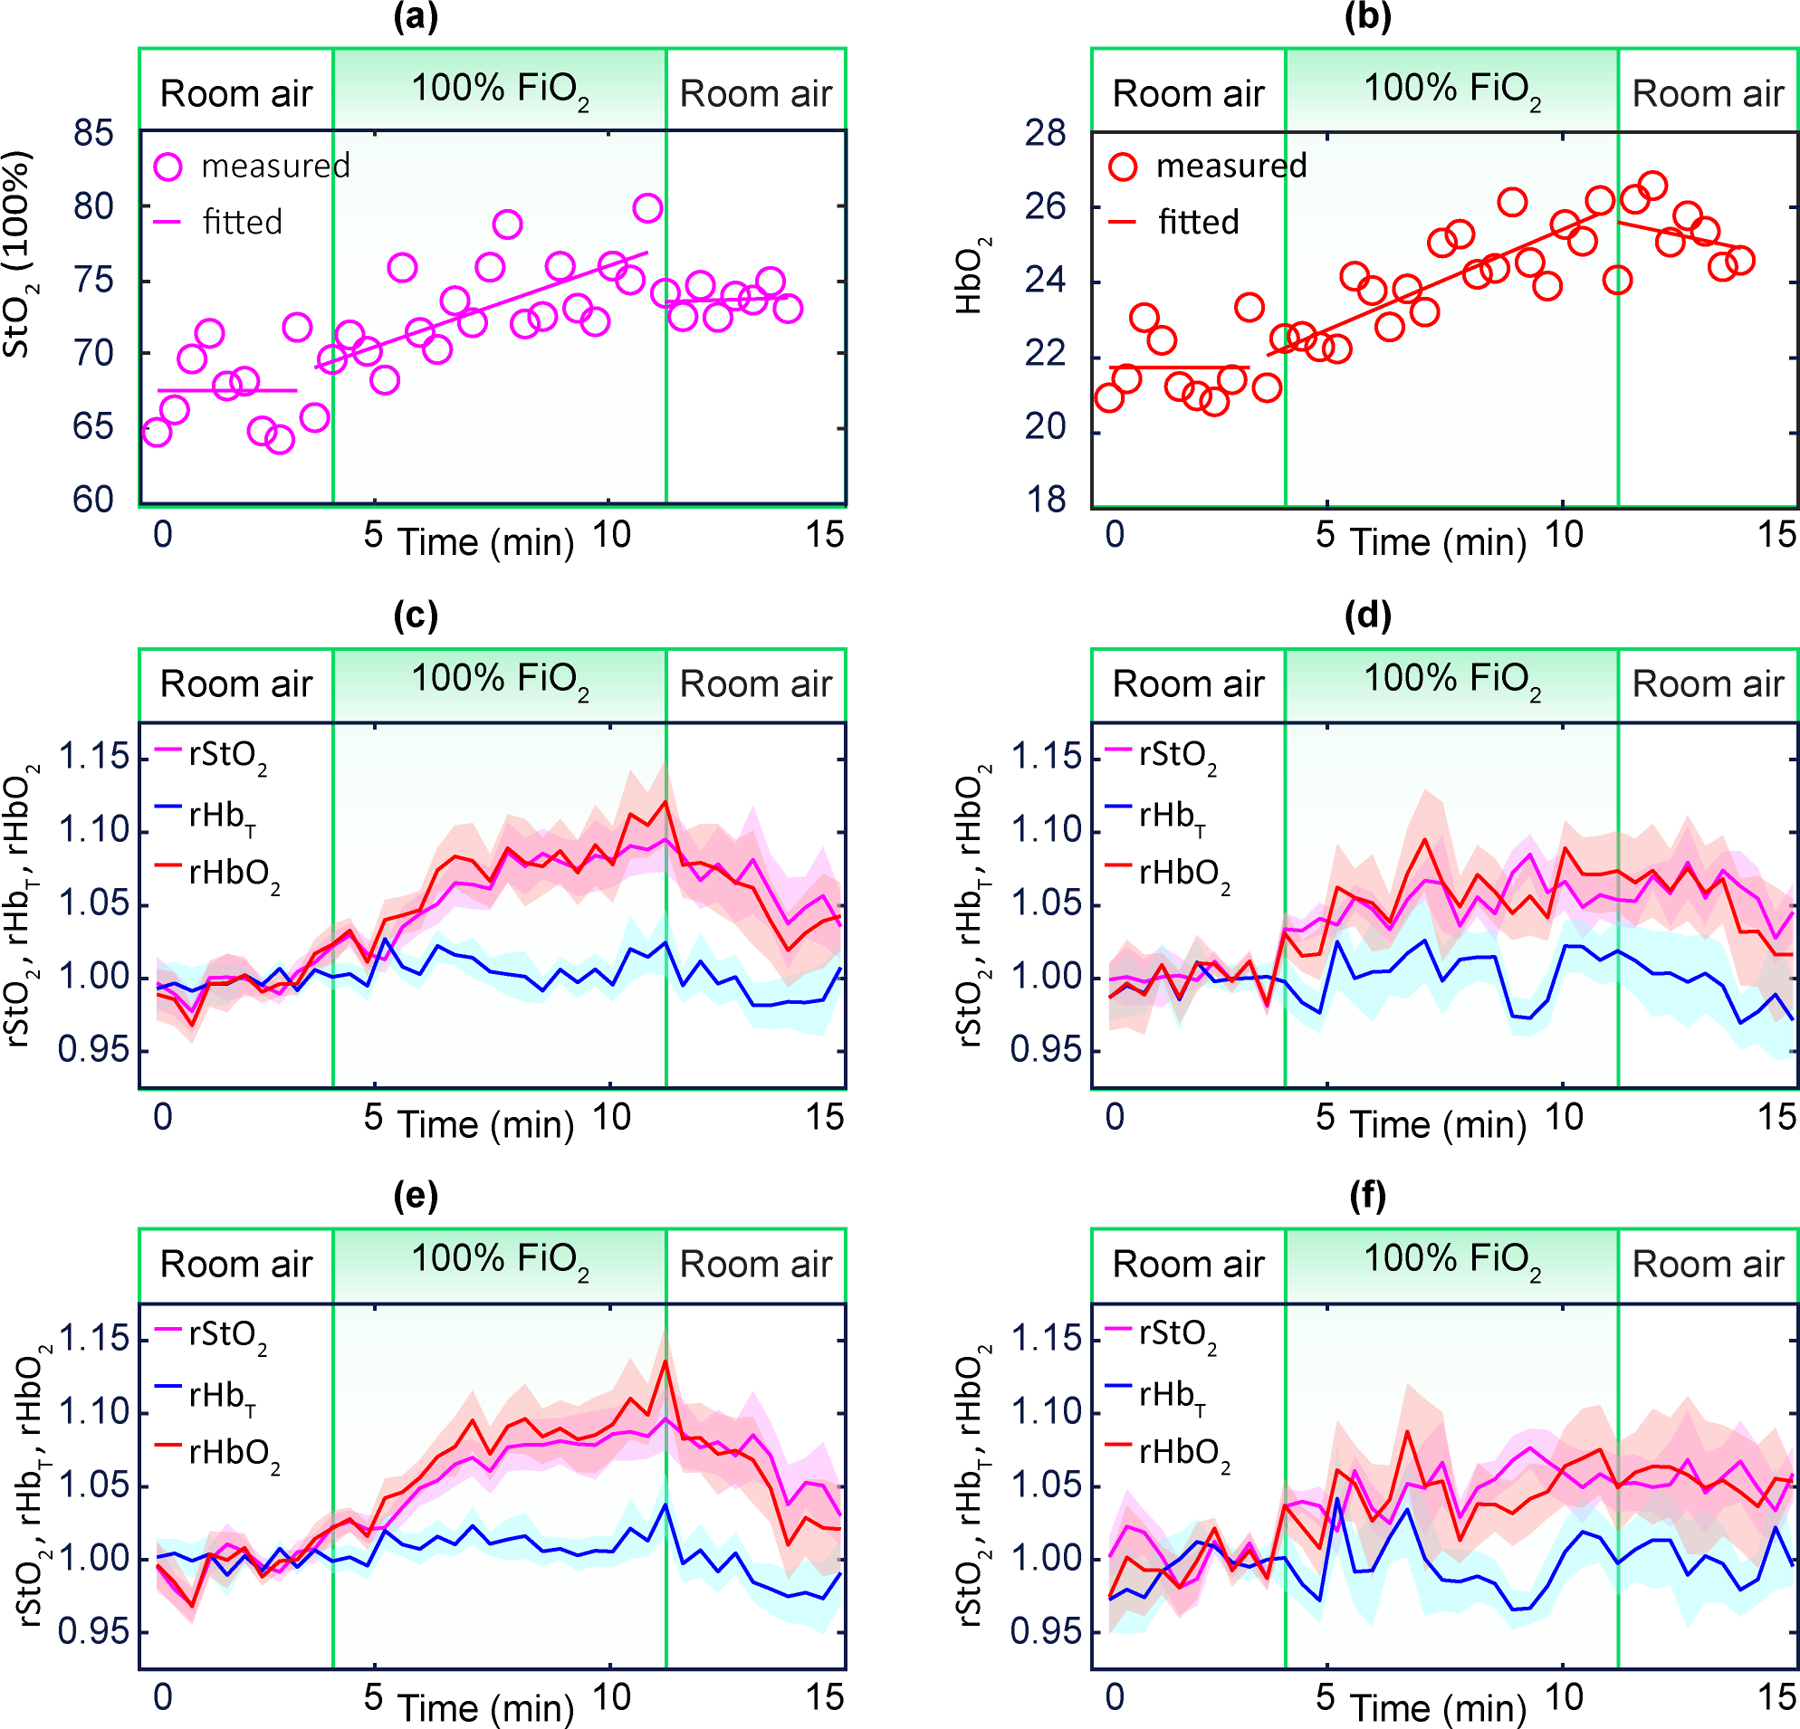
Fig. 4 |. Continuous monitoring of placental haemoglobin properties during maternal hyperoxia.

a,b, Exemple case of and during maternal hyperoxia. c,d, Averaged placental (purple), (blue), and (red) for NPO participants (n = 15) and for participants with APO (n = 9). e,f, Averaged placental (purple), (blue) and (red) for NPP participants (n = 16) and for participants with MVM (n = 8). Shaded regions represent the standard error. The cohort-averaged and exhibit a significant increase during maternal hyperoxia for the NPO and NPP groups, but a blunted response for the APO and MVM groups.
