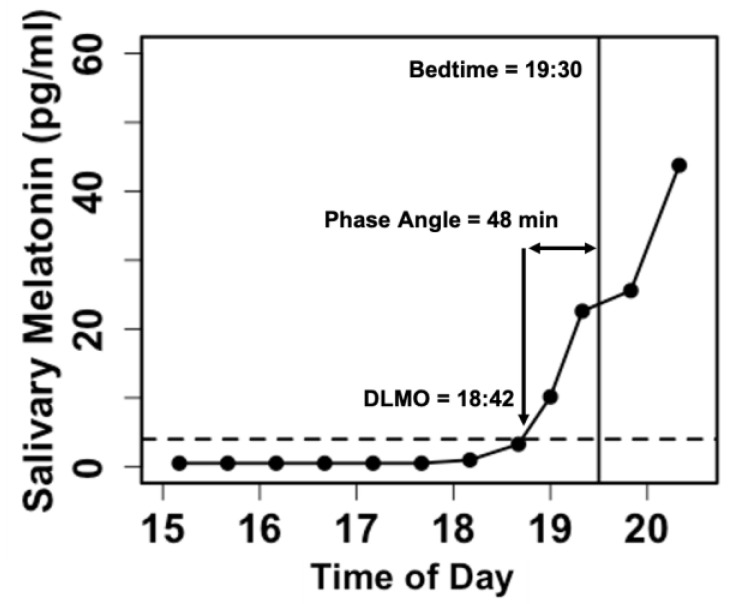
Figure 4.
Example of a dim light melatonin curve for one individual child participant. Each black dot represents a saliva sample collected. The dotted line denotes the DLMO threshold of 4 pg/ml. In this example, the child’s scheduled bedtime (lights-out time) was 19:30. DLMO was calculated as 18:42. The phase angle difference between lights-out time and DLMO was 48 min.

