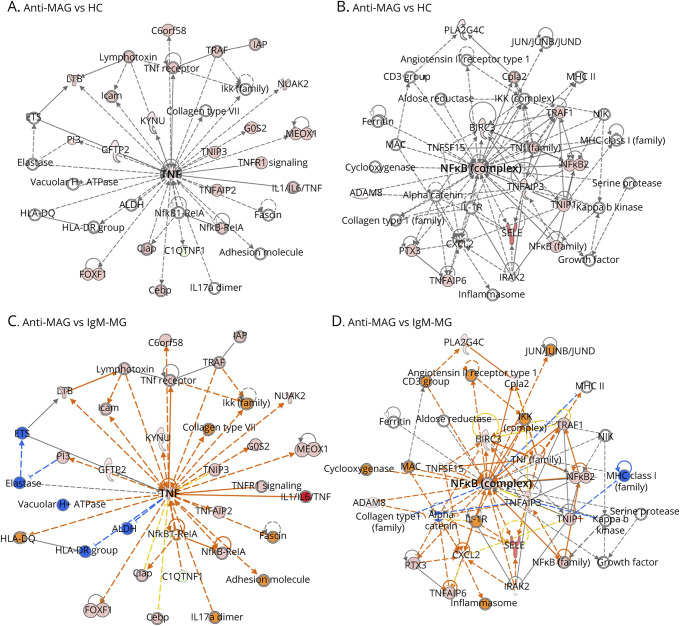
Figure 1. Whole Transcriptome Analysis (Using RNA-Seq) of PnMECs After Exposure to Sera From Patients With Anti-MAG Neuropathy.
Human PnMECs were incubated with 10% sera from patients with anti-MAG neuropathy (MAG, n = 4), HCs (n = 4), and patients with IgM-MG (n = 4). PnMECs without exposure to IgGs were also used as controls. In the network analysis of upregulated genes, TNF-α and NF-κB were detected in the center of the network analysis in anti-MAG neuropathy in comparison to in HCs (A and B) or IgM-MG neuropathy (C and D). The red nodes show the upregulated genes in the RNA-seq analysis (FC > 1.5; p < 0.05). Anti-MAG = anti-MAG neuropathy; HC = healthy control; IgM-MG = IgM–monoclonal gammopathy neuropathy; MAG = myelin-associated glycoprotein; NF-κB = nuclear factor-kappa B; PnMECs = peripheral nerve microvascular endothelial cells; TNF = tumor necrosis factor.

